OR-Notes are a series of introductory notes on topics that fall under the broad heading of the field of operations research (OR). They were originally used by me in an introductory OR course I give at Imperial College. They are now available for use by any students and teachers interested in OR subject to the following conditions.
A full list of the topics available in OR-Notes can be found here.
One important extensions to the basic network analysis technique relates to resource restrictions.
Typically, in real-world network analysis, each activity has associated with it some resources (such as men, machinery, materials, etc). We mentioned before that, in calculating the minimum overall project completion time, we took no account of any resource restrictions. To illustrate how network analysis can be extended to deal with resource restrictions consider the activity on node network we had before in the case of certainty with respect to activity completion times, for which the network diagram is reproduced below.
The Gantt chart below (taken from the package output) illustrates when each activity can take place. To meet the minimum project completion time of 24 weeks for the above project critical activities must take place at fixed points in time. For non-critical activities however we have flexibility (within limits) as to precisely when these activities take place.
To remind you of the interpretation of the Gantt chart below the package displays both the earliest and latest times for each activity and the critical path for the project (using suitable colours). Each activity has two horizontal bars. The first bar represents when it will take place if it is started at its earliest start time. The second bar represents when it will take place if it is started at its latest start time. Obviously for critical activities the two bars are identical.
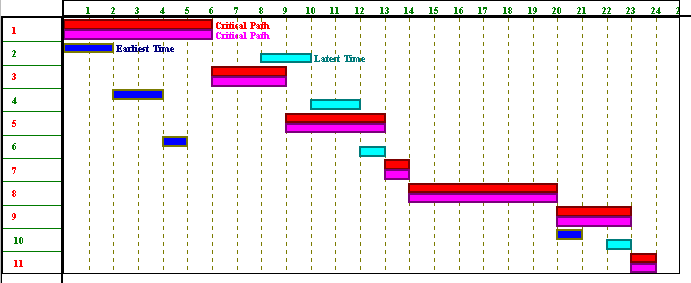
Hence for this project the critical activities are 1,3,5,7,8,9 and 11 and the non-critical activities are 2,4,6 and 10.
We consider two different types of resource restricted problem:
Note here that dealing effectively with resource restrictions is hard (both computationally and theoretically). Resource constrained problems are very hard to solve and resource smoothing problems, although easier, are also hard to solve.
The word resource here is used to denote any item (e.g. men, machinery, materials, cash) needed to ensure activities take place. Resources can essentially be classified as:
We shall deal below with resources that are renewable per time period.
Resources that are non-renewable over the lifetime of the project are sometimes dealt with in a similar manner as we did previously for cost/time tradeoff. Another example dealing with a non-renewable resource can be seen when we come to consider the use of integer programming in project planning.
Suppose now that we have just one resource (men) associated with each activity and that the number of men required are:
If you click here you will be able to download an Excel 97 spreadsheet called res1.xls with which you can explore using resources in the network above. The examples given below are produced using this spreadsheet.
NOTE here that you may experience difficulties in downloading the above spreadsheet - this could (in techie speak) be due to various reasons such as:
if this happens then email me and I will see if I make the file available in another format.
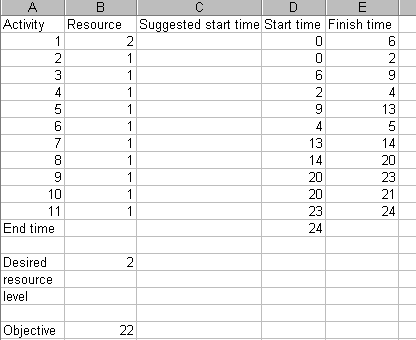
The spreadsheet is shown (in part) below. Column B in that spreadsheet gives the resource usage for each activity, column C a suggested start time (if we wish to impose our own suggested start time for each activity). Columns D and E show the start and finish time for each activity. The values for the cells in these columns are set using the underlying precedence relationships in the network seen above. Cell D13 shows the end time (when all activities have been completed, i.e. the project completion time). There are other cells in the spreadsheet that contain values but these are either concerned with internal calculations in order to calculate a resource profile or are for features that we have yet to discuss.
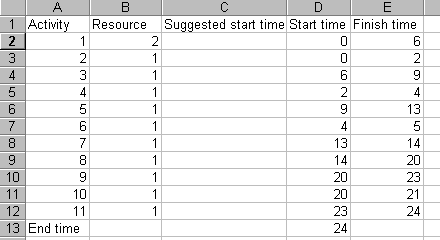
Suppose now that we decide:
then in the light of these decisions what does the plot (profile) of resource usage (number of men used) against time look like?
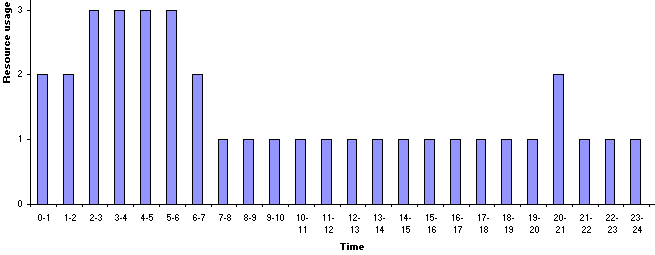
Using our spreadsheet we can see that the plot of resource usage against time is as below.
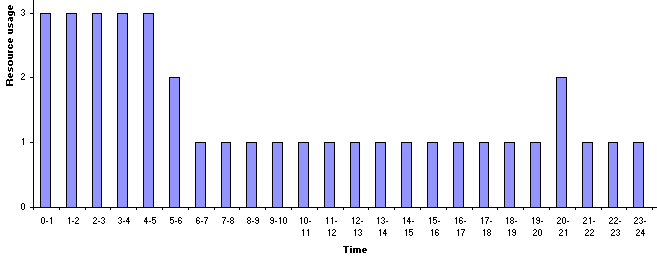
The peak of the resource profile is associated with the start of the project, when activity 1 requires 2 men and the other activities, which are being performed simultaneously with activity 1, require one man.
A key question is:
What resource usage profile would we have most liked to have seen here?
Clearly what we would have most liked to have seen here is a constant profile of resource against time, i.e. a constant usage of resource over time. This is because variations from a constant (straight line) profile most likely cost us extra money - either in terms of hiring extra resource to cover peaks in the resource profile, or in terms of unutilised resources when we have troughs in the resource profile. Whilst it may not be possible to achieve an ideal resource profile we should keep this ideal in mind.
Now another key question is:
Is the resource profile that we see fixed or can it be altered?
The simple answer is that the resource profile is not fixed. It can be altered. Simply put changing the start time for an activity changes the resource profile. This is illustrated below where we have changed the start time for activity 2 to time 2. It can be seen that the project still completes in 24 weeks, but the resource profile is different.
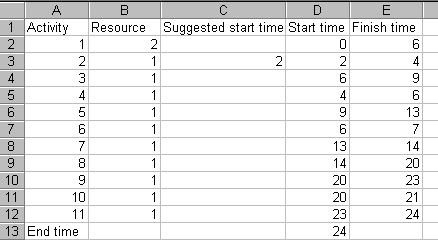
So is our current usage of resource ideal? Plainly not, but what flexibility do we have? If we still wish to complete in 24 weeks we can do NOTHING with regard to the critical activities.
However we have some choice for the non-critical activities. Recall that such activities have an associated float (slack) time. We could artificially delay starting some of these activities. If we do so the resource profile will change, maybe for the better. Indeed this is what we did implicitly above. There, in delaying the start of activity 2 until time 2, we still completed the project on time, but had a different resource profile. In fact for this particular example it is easy to see that delaying starting activity 2 until time 6 leads to a better resource profile, and is still feasible in terms of the 24 weeks completion time.
Using our spreadsheet to delay starting activity 2 until time 6, when activity 1 will have finished we have:


Here we clearly have a resource profile more in line with our ideal of a constant resource usage.
It is important to note however that artificially delaying the start of non-critical activities in order to improve a resource profile is not free. Rather it costs us. Simply put time lost by delaying the start of an activity cannot later be regained (if things do not turn out as planned) given the desired fixed completion time for the overall project.
This has illustrated the resource smoothing or resource levelling problem, which can be stated as:
Given a fixed overall project completion time (which we know is feasible with respect to the resource constraints) "smooth" the usage of resources over the timescale of the project (so that, for example, we do not get large changes between one week and the next in the number of men we need).
This smoothing process makes creative use of float to artificially delay activities in order to smooth resource usage.
There are two disadvantages to smoothing:
In the above example we smoothed the usage of resource by eye, altering a start time and seeing if we preferred (visually) the resulting resource profile. Obviously if this process is to be done automatically by a computer, which lacks our eyes, a more systematic approach is needed.
One approach to systematically deciding start times so as to smooth resource usage is to first decide upon an objective function. We can then let the computer adjust start times for non-critical activities so as to respect the overall project completion time and minimise our objective function.
One suitable objective function is given by setting a desired target constant resource usage R and then, if the usage of resource in time period t is rt adjusting start times so as to minimise sum[over all time periods t] (rt - R)2, i.e. to minimise total squared deviations from the target level. The logic behind using squared deviations as the function to be minimised is that the squared term will discriminate against unusually large deviations.
Note here that this objective assumes that deviations above and below target are equivalent. Plainly we could vary our objective, for example to attach different weights to deviations above target as against deviations below target. However you should be clear that, in essence, there is no law of the universe which tells us what the objective function in resource smoothing should be.
As an illustration of what can be done we will use the Solver option within Excel.
The spreadsheet is shown below. The desired resource level R is entered in cell B15 and the value of the objective function, sum[over all time periods t] (rt - R)2, given the start times for each activity as in column D is given in cell B19.
To use Solver in Excel do Tools and then Solver - if Solver does not appear then you do not have Solver installed. Solver is a component that comes with Excel, but not everybody chooses to install Solver at the same time as they install Excel. If you do not have Solver installed you will need to go back and reinstall Excel to add in the Solver component. Help on using Solver is available here.
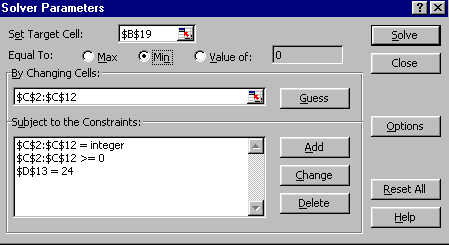
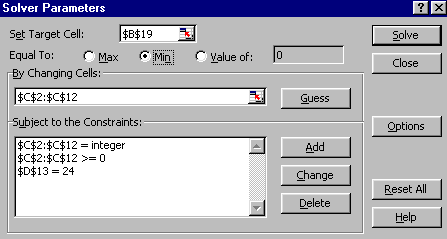
The Solver model is as below. The target cell is B19 (ignore the dollar signs) which we wish to minimise by adjusting (changing) the cells C2 to C12, which contain the suggested start times. The constraints are that the suggested start times are integer and >=0 (we will ignore fractional start times for simplicity) and that we wish to finish the project (cell D13) in exactly 24 weeks (the minimum possible project completion time).
Note here that (strictly) we know that to complete the project in 24 weeks we can only adjust the start times for the non-critical activities (activities 2,4,6 and 10), since the start times for the critical activities are fixed. This would imply that we need only enter cells C3,C5,C7 and C11 in the By Changing Cells box (enter as $C$3,$C$5,$C$7,$C$11). However in order to anticipate some of the examples given later below we have declared the start times for all activities (i.e. cells C2 to C12 inclusive) adjustable here.
Clicking on the Solve button in the spreadsheet is very disappointing, as can be seen below.
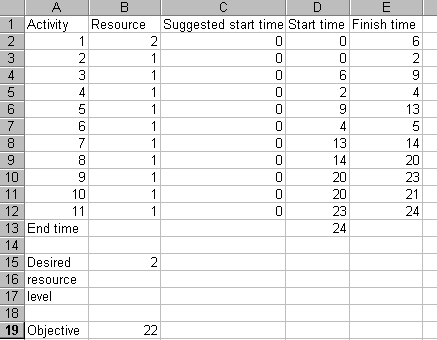
Solver has suggested start times of zero, effectively not altering our actual start times (column D above) at all. Still, what can you expect from Microsoft software! The way to perturb the situation, and get some decent results from Solver, is to suggest some start times of our own to get Solver started appropriately. For example, setting the suggested start time for activity 2 to 1 (i.e. set cell C3 to one) and invoking Solver produces the solution shown below.
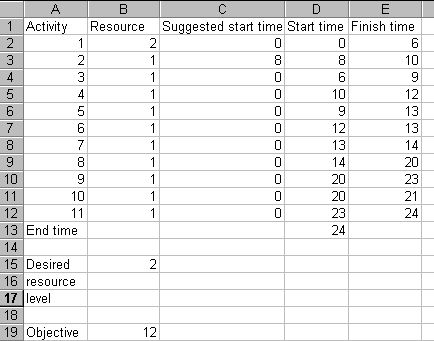
with the associated resource profile being
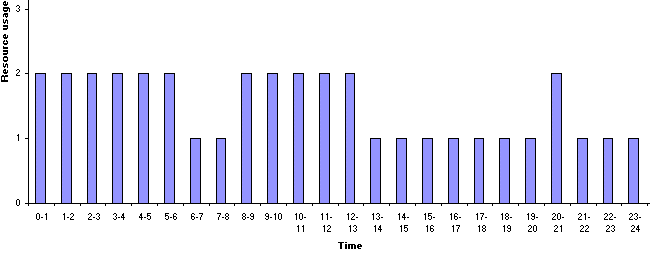
which is plainly a satisfactory solution (consider that the objective has decreased from 22 to 12).
Note that the difficulties we encountered with Solver above are not simply a matter of poor software. There are inherent mathematical problems in optimising a nonlinear function such as the objective we have adopted.
To try and compensate for these inherent mathematical difficulties one tip I can offer is that we can try Solver a number of different times. This can be done as:
An example of this is shown below where in the initial solution shown each suggested start time has been produced using the Excel formula =24*rand(), which produces a random number between 0 and 24 (the duration of the project):

This is plainly a solution we would not wish to have - involving as it does a completion time of over 36 weeks. However, from this solution we, by invoking Solver, get
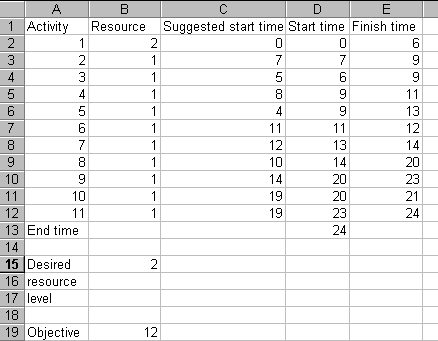
which is a solution with the same objective value as before.
Note here that although above Solver produces suggested start times for all activities some of these start times are irrelevant. For example the suggested start time of 4 for activity 5 is irrelevant as the preceding activities mean that it cannot actually start until time 9. The figures in column D are the times at which activities will actually start. The reason for adopting suggested start times above is that it enables us to produce, via Excel, start times that we can use to influence when activities start in the network (see the underlying spreadsheet logic, which I am not going to discuss in any detail here!). Henceforth below we have in many cases (artificially) adjusted all Solver output so as to clear cells involving suggested start times that are having no influence on the situation.
The resource profile for this solution, and the Gantt chart (taken from the Excel spreadsheet) are shown below. Note here that in the Excel Gantt chart the activities are along the horizontal axis and time along the vertical axis (unlike the Gantt charts we have seen up to now).
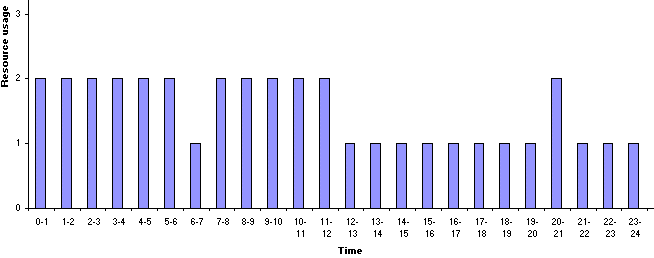
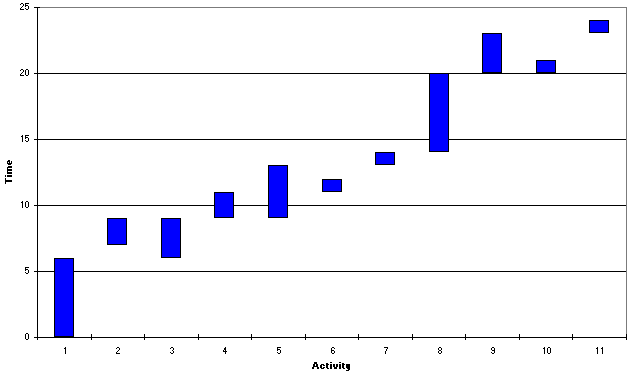
There is one technical issue concerned with Excel here, namely if you try the above example you may get a different solution. This is because the rand() function in Excel is recalculated each time you change the spreadsheet (you may know that spreadsheets work by automatically recalculating values in cells in the light of changes). To prevent this happening you need to type =24*rand() and then press the F9 key to convert immediately from a formula (which is subject to recalculation) to a number.
Note here therefore that this issue as to random number recalculation in Excel may also affect what you get if you try some of the examples below. If you are concerned about this and wish to reproduce the answers seen here just type into the suggested start time column the answers from Solver you see given here.
You may have noticed that in the above example the resource used per time period never went above the desired resource level of 2. This, in fact, was purely coincidental, nothing in the Solver model for resource smoothing prevented the resource used in any time period exceeding this level.
To illustrate this, and to give an example that is less easy to smooth by eye consider the same network as before but now with a different resource usage for each activity, as seen in the spreadsheet below.
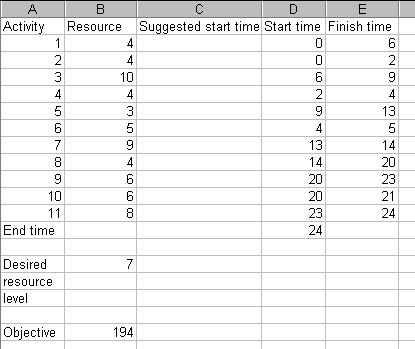
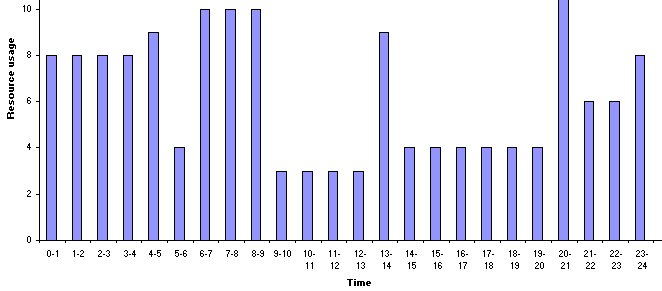
With a desired resource level per time period of 7, and the resource profile for the start times above as below, what start times for the non-critical activities would you suggest?
Well, invoking Solver, with again (following our tip above) =24*rand() as a randomly generated suggested starting time gives the solution below.
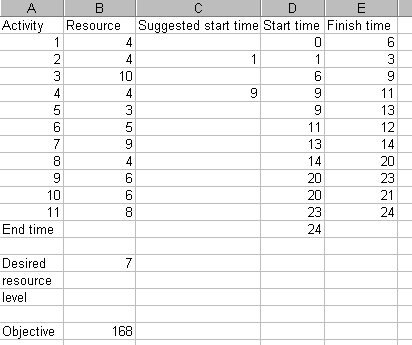
with the resource profile and Gantt chart as below.
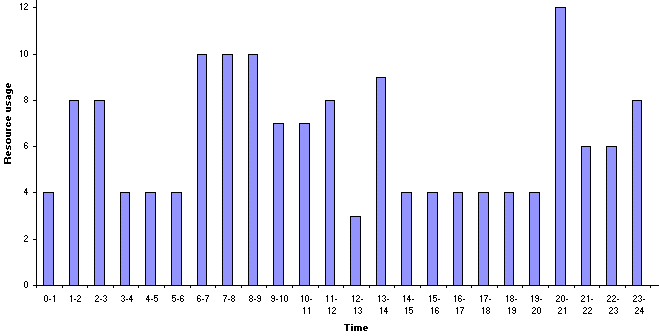
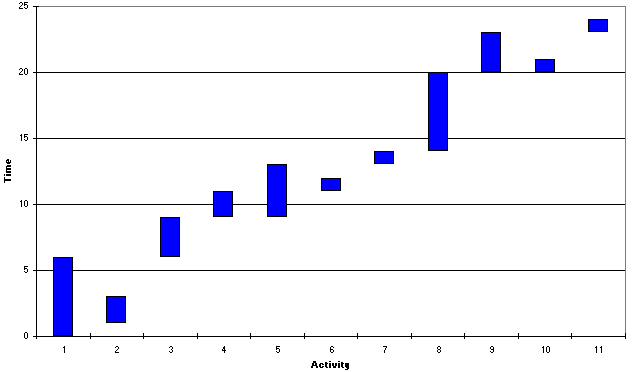
Note that for this example we do exceed the desired resource level of 7 at times, and also (unlike our previous example) there is a "gap" between the end of activity 2 and the start of activity 4.
Now it may be that we consider the above resource profile is not smooth enough. We could however investigate the effect of increasing the project duration. This may enable us to produce a better resource profile. It certainly has one important effect - whereas before critical activities were fixed in time to meet the overall minimum project completion time, now if we are prepared to see an increase in project duration these are not fixed in time but their start times can be varied, with consequently potential beneficial effects upon the resource profile.
Considering, for example, a completion time of 25 weeks the changes necessary to Solver are shown below.

It can be seen that the only change relates to the constraint for the project completion time, which is now constrained to be exactly equal to 25. Note in passing that now we can genuinely adjust the start times for all activities (cells C2 to C12 inclusive). This is because some critical activities can perhaps be delayed in meeting the completion time of 25 weeks.
After a number of random starts with Solver we have the solution below
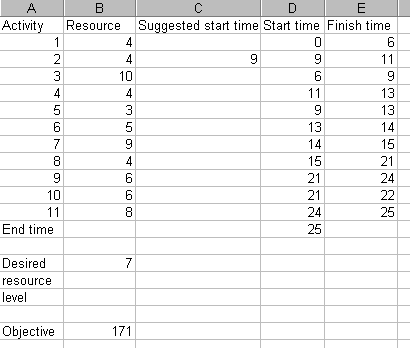
with the resource profile and Gantt chart being
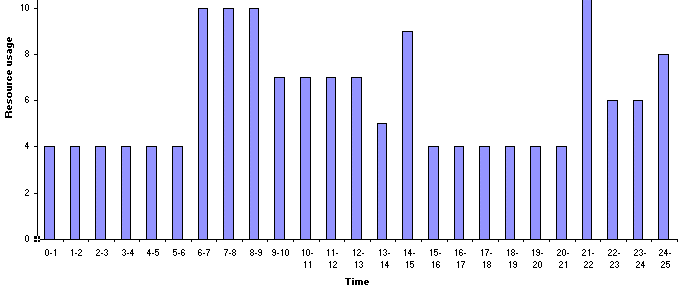
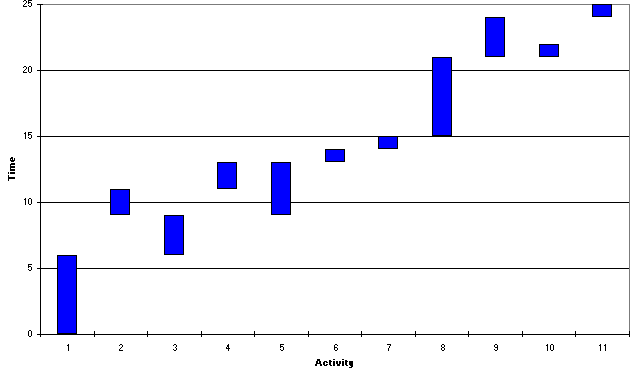
Here the Gantt chart shows that activity 6 has been inserted between the previously successive critical activities of 5 and 7. Visually the resource profile seems smoother for this 25 week solution than for the 24 week solution - yet the objective value of 171 is larger than the previous objective value of 168. How then can we explain this?
The answer lies in the way we defined our objective - as the sum of the squared deviations from the desired resource level over the time period. Hence the 171 relates to a 25 week period, and the 168 to a 24 week period. Comparing them on a weekly basis (mean squared deviation from desired level per week) the 25 week solution has a weekly value of 171/25 = 6.84 and the 24 week solution has a weekly value of 168/24 = 7.00. Hence on a weekly basis the 25 week solution is indeed "more smooth" than the 24 week solution (as we would expect from a visual comparison).
Continuing in this vein the best solution I can manage to produce for a 26 week completion using Solver is shown below.
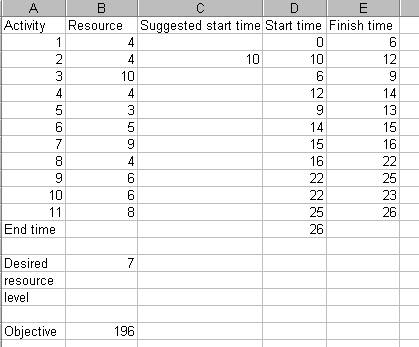
On a weekly evaluation this has a smoothness of 196/26 = 7.54, so less smooth than either the 24 week or the 25 week solution.
Note here because of the inherent mathematical difficulties in solving a nonlinear optimisation problem alluded to before we can never be sure whether ANY solution is the best solution (i.e. optimal) that can EVER be found (logically there must be a set of start times that yield the minimum value for the smoothing objective we have adopted) or not.
However, the solutions we have are the best we can get (optimal or not!) and we now have a decision problem - given possible completion times:
which completion time would you choose?
The situation here is exactly analogous to the one that occurred when we considered cost/time tradeoff. The package gives you information as to the effect of trading off completion time against smoothness. The actual decision as to the completion time to choose is one that must be taken by a human decision-maker.
To expand our example suppose that we now have two resources associated with each activity. If you click here you will be able to download an Excel 97 spreadsheet called res2.xls with which you can explore using two resources in the network above. The examples given below are produced using this spreadsheet.
In this spreadsheet the data for Resource 1 can be found under the Resource 1 data tab and the data for resource 2 can be found under the Resource 2 data tab. The data for resource 1 is
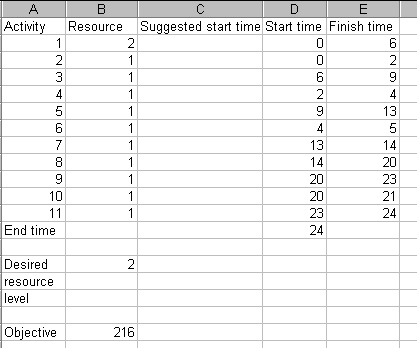
and the data for resource 2 is
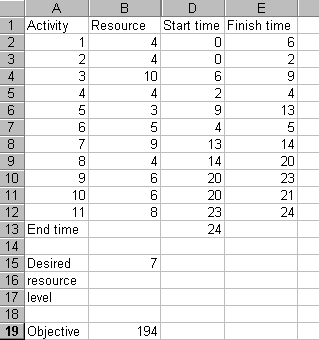
It can be seen that this data is a combination of the two examples considered previously under the single resource case. In this spreadsheet suggested start times are entered in the Resource 1 data tab sheet, they are automatically transferred across to the Resource 2 data tab sheet.
The resource profile for the start times shown above is as below.
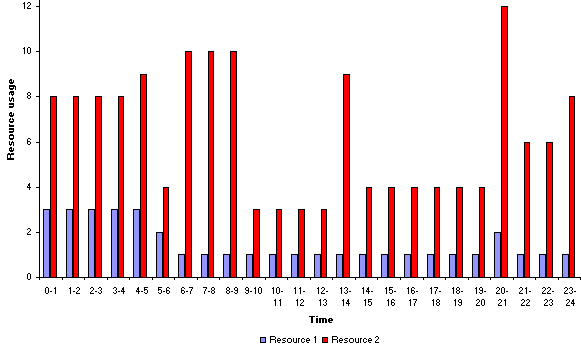
Now if we wish to smooth this profile, for the desired resource level of 2 for resource 1 and the desired resource level of 7 for resource 2 we can simply add together the squared deviations from desired resource level for each resource in order to generate a single objective to be minimised. Note here that this assumes that each resource is equally important. Whilst we could weight our objective to place differing importance on each resource this is an unnecessary complication here.
In the spreadsheet the objective value shown in the Resource 2 data tab sheet is the total squared deviations from desired level for resource 2. The objective value shown in the Resource 1 data tab sheet is the total squared deviations from desired level for resources 1 and 2 combined. We can now carry out the same procedure as before. The Solver parameters are set in the Resource 1 data tab sheet and are as before (see below) for a completion time of 24 weeks.
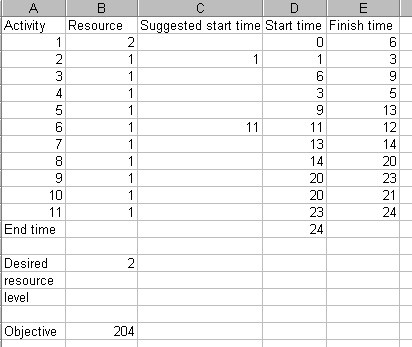
After a number of tries using Solver the best solution I can obtain is shown below.
The corresponding resource profile and Gantt chart are shown below.
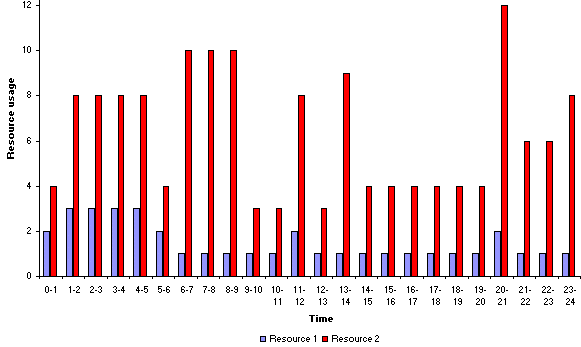
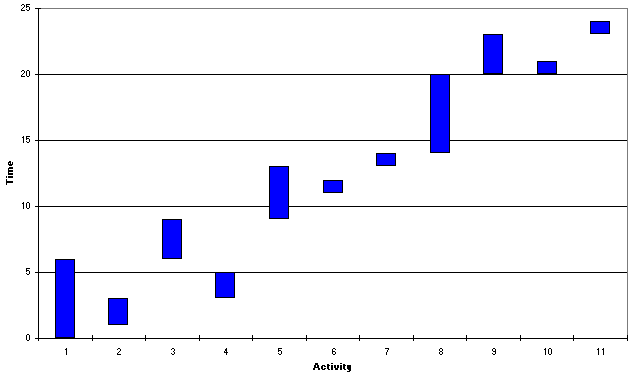
It can be seen that in this case activity 6 is delayed until some time after the end of activity 4.
On a weekly evaluation this solution has a smoothness of 204/24 = 8.5. Continuing as we did for the single resource example above, the best solution I can find for a completion time of 25 weeks is:
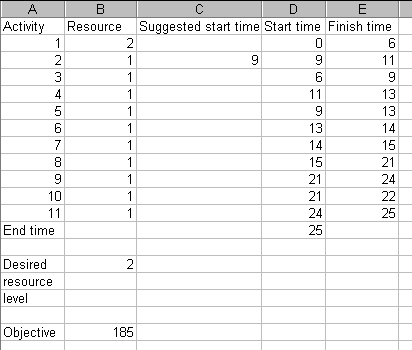
which has a weekly smoothness value of 185/25 =7.4, and the best solution I can find for a completion time of 26 weeks is:
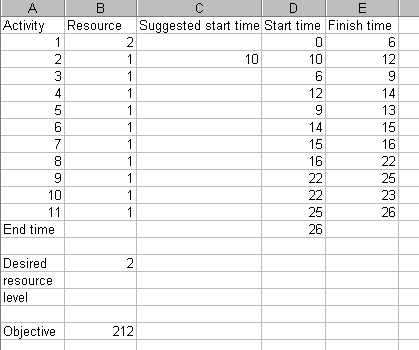
which has a weekly smoothness value of 212/26 = 8.15.
Hence, as we did before for a single resource, we have the information to make an informed decision as to which completion time to have:
For interest the resource profile for the lowest smoothness value of 7.4 found is shown below.
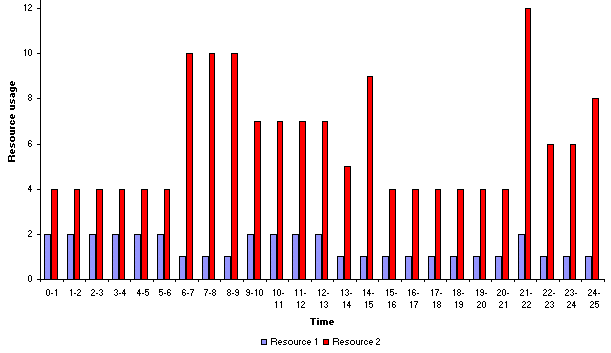
So far in smoothing a resource profile we have been prepared to accept resource usage above our desired resource level. In some circumstances however we have an absolute constraint upon the maximum level of resource that can be used in any time period. To illustrate this if you click here you will be able to download an Excel 97 spreadsheet called res3.xls with which you can explore resource constrained problems in the network we are considering. The examples given below are produced using this spreadsheet.
To remind you of it the network for the project we are considering is
The spreadsheet is shown below.
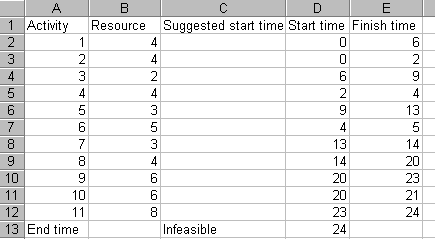
The resource profile for the start times shown above is as below.
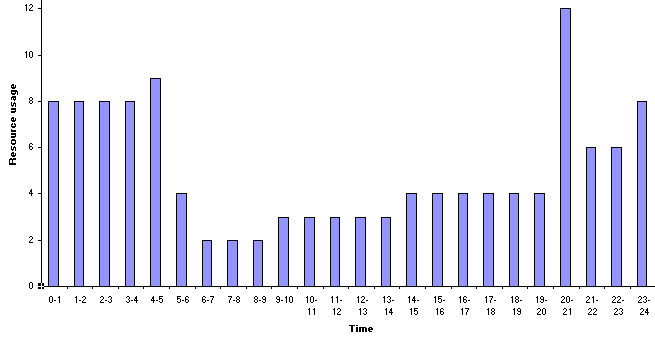
Here we have assumed that we wish to impose an absolute limit of 8 on the usage of our single resource in any time period. The current resource profile violates this constraint and this is indicated by cell C13 in the spreadsheet saying "Infeasible".
Whilst we know that from the time point of view the minimum project completion time is 24 weeks a key question is: can we still achieve the same minimum project completion time when a resource constraint is added?
The answer to this question is that sometimes it is impossible to achieve the same completion time. For this problem, for example, activities 9 and 10 are performed simultaneously in achieving the minimum overall project completion time of 24 weeks (e.g. consider the network diagram shown above). Activity 9 requires 6 resource units, activity 10 requires 6 resource units. It is clear therefore that, in the presence of a resource constraint of 8 units these two activities cannot be performed simultaneously. Hence for this network we immediately know that the original completion time of 24 weeks is no longer feasible.
The question therefore arises as to what is the minimum overall project completion time for this project when resource constraints are taken into account.
This has illustrated the resource constrained or resource allocation problem, which can be stated as:
Given the activities, their associated resource usage, precedence relationships and resource restrictions (typically expressed as the amount of each resource available per time period) find the minimum overall project completion time (which satisfies both the precedence relationships and the resource restrictions).
Note here that resource constrained problems are much harder (both theoretically and computationally) to solve than resource smoothing problems. This will become apparent computationally below if you use the spreadsheet to attempt to solve a resource constrained problem. Whilst for our small example we might well be able to see using our eyes/brain what is the minimum overall project completion time (which satisfies both the precedence relationships and the resource restrictions) for larger/more complex examples this is impossible.
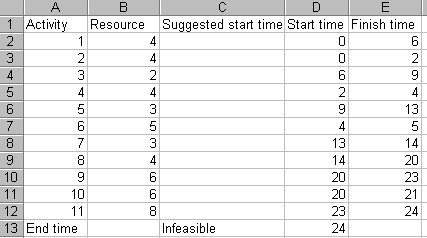
In order to gain some insight into how we might go about estimating the minimum project completion time when we have a resource constraint of 8 we can start from the resource unconstrained solution. This is shown below together with the resource profile and Gantt chart.
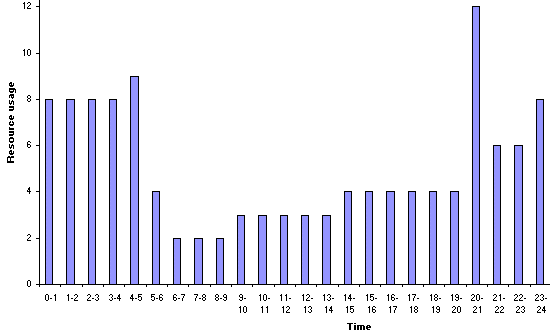
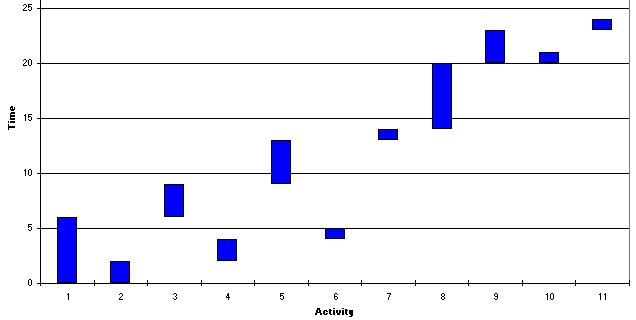
Examining the resource profile the first point at which we exceed the resource constraint of 8 is at time 4-5. Examining the Gantt chart this is associated with activity 6 (requiring 5 resource units) being performed simultaneously with activity 1 (which requires 4 resource units).
This illustrates a general truth: increases in the resource profile can only be caused by one (or more) activities starting
Plainly one (or other) of activities 1 and 6 needs to be delayed to prevent us violating our resource constraint. Here, as at time 4-5 we have already started activity 1, we choose to delay activity 6 until activity 1 has finished. Hence we have a suggested start time for activity 6 of 6. Entering this into the spreadsheet we get:
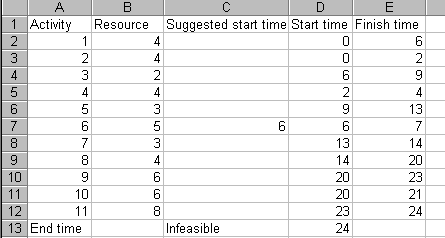
with the resource profile and Gantt chart being:

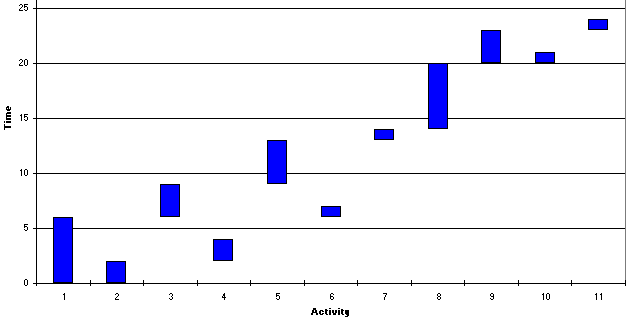
Examining the resource profile above the first point at which we now exceed the resource constraint of 8 is at time 20-21. Examining the Gantt chart above this is associated with activity 9 (requiring 6 resource units) being performed simultaneously with activity 10 (which requires 6 resource units). Plainly one (or other) of these activities needs to be delayed. Here, we choose to delay the activity with the smallest completion time (activity 10) until activity 9 has finished. (More logically we typically choose to delay activities which are non-critical in the unconstrained case, and if there are more than one such activity choose the one with the smallest completion time). Hence we have a suggested start time for activity 10 of 23. Entering this into the spreadsheet we get:

which we can see is declared to be feasible (cell C13 above, i.e. it satisfies the resource constraint), with a resource profile of:

Hence we have a feasible solution to the problem of determining the start time for each activity so as to respect the resource constraints and the network precedence relationships. This solution involves completing the project in 25 weeks. This may, or may not, be the optimal (minimum) project completion time when we have our resource constraint of 8 present.
Hence we can suggest a general procedure (algorithm) for estimating the minimum possible project completion time in the presence of resource constraints as follow:
Then repeat the following until the resource constraints are satisfied:
Although we did not phrase our approach above in these terms you should be able to see that if we had set out this general approach first, and then applied it to the above example, we would have ended up with exactly the same solution.
Now we might expect that instead of estimating the minimum possible project completion time we could estimate it directly using our Excel spreadsheet and Solver. Even though we cannot guarantee to find the minimum possible project completion time we might perhaps expect (certainly for this small example) Solver to perform well. The Solver input parameters for this example, in order to estimate the minimum resource constrained project completion time, are as below.

The target cell to be minimised is cell D13, which contains the project completion time. The constraint forcing D13 (the project completion time) to be <= 45 is necessary since in the Excel spreadsheet we (for technical reasons associated with the resource profile) have to set a time horizon. Here I have (arbitrarily) chosen to set a time horizon of 45 weeks. Any start times which mean that the project takes longer than 45 weeks cannot be considered since in those cases the spreadsheet logic breaks down. The constraint forcing cells H13 to AZ13 (inclusive) to be <= 8 is the resource constraint (these cells contain the number of units of resource rt used in each time period t in the 45 week time horizon).
Using Solver and starting from the resource unconstrained case we get

indicating that Solver could not find a solution which satisfied the constraints of the problem. The difficulty here is in ensuring that the resource constraints for each and every period are satisfied.
Hence again we need to provide Solver with a starting solution. My experience here has been that Solver works better if it is provided with a starting solution which is already feasible rather than a starting solution which is infeasible. One way of doing this, for this particular example, is to set the suggested start time for the first activity to 0 and the suggested start time for all other activities i equal to the finish time of activity (i-1). Doing this gives the feasible starting solution:
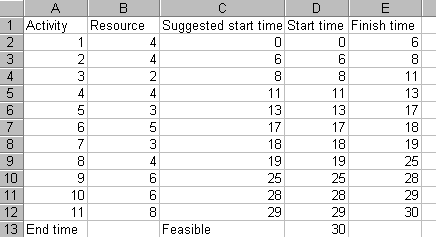
Unfortunately Solver fails to improve on this solution - which is disappointing given that we know that we have estimated the minimum project completion time as 25. Indeed it is especially disappointing since changing the suggested start time for activity 2 in the spreadsheet above immediately gives:

which is a better feasible solution, which again Solver fails to improve on.
Using a number of random starting solutions for Solver the best solution I could obtain was the one above. If you try this for yourself may observe during the solution process that the compute time consumed is much greater than when we were doing resource smoothing.
Let us be clear above what this example has illustrated - whilst we may have expected that using Solver would enable us to get a good estimate of the minimum possible project completion time when we have a resource constraint present we have observed that in fact a sequential approach, based on systematically applying a set of rules, performed much better. Whilst there are better algorithms than Solver for producing estimates of the minimum possible project completion time in the presence of resource constraints be aware that these may, as above, not perform well in certain circumstances.
Above we saw that our attempt to use Solver to find the minimum resource constrained project completion time was disappointing. The difficulty was that Solver could not cope very well with the resource constraints. Well it turns out that, if we think laterally, we can remove the resource constraints from Solver.
To illustrate this if you click here you will be able to download an Excel 97 spreadsheet called res4.xls with which you can explore this in the network we are considering. The examples given below are produced using this spreadsheet.
The spreadsheet is shown below focusing on cell D14. In the formula for that cell the term MAX(H13:AZ13) will give the maximum resource used in any time period over the 45 week horizon adopted. Hence the term MAX(0, maximum resource usage - 8) will be equal to 0 if the resource profile satisfies the resource constraint of 8, else > 0. In cell D14 therefore D13 (the project completion time) plus 100 multiplied by this resource based term will equal the project duration if the solution is feasible, else it will exceed 100 and the project will be infeasible with respect to the resource constraint of 8.
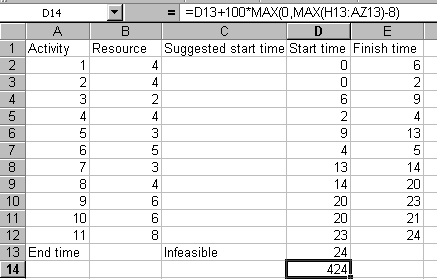
Consider now the Solver input parameters shown below. Here we have a similar model as before, but now we are minimising cell D14 (which contains the project completion time plus a resource based term, as discussed above). Also we no longer need a constraint relating to resource in Solver - if when we solve the solution has value less than 100 it is automatically feasible, if the solution has value more than 100 it is infeasible.
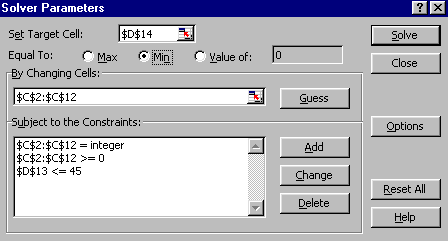
Technically this incorporation into the Solver objective function of the resource constraint is known as a penalty based (penalty function) approach.
Starting from the solution below (see the discussion previously)
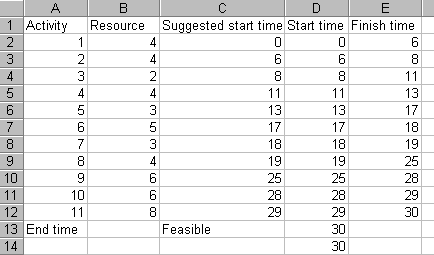
and using Solver we get
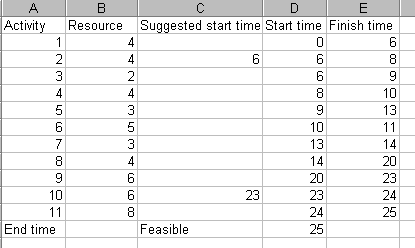
which is equal to the (feasible) solution we found before. This example illustrates that thinking laterally when faced with a system like Solver (which prefers fewer constraints) can pay substantial benefits.
Clearly it is possible to combine resource smoothing and resource constraints. To illustrate this suppose we take the resource constrained problem considered above and seek to smooth the project within our 25 week deadline with a desired resource level of 7 (note here that the desired resource level need not be equal to the maximum resource level, 8 in this case). Using Solver to achieve this we will use the spreadsheet res4.xls we used above. The spreadsheet (starting from the starting solution discussed above) and Solver parameters will be:

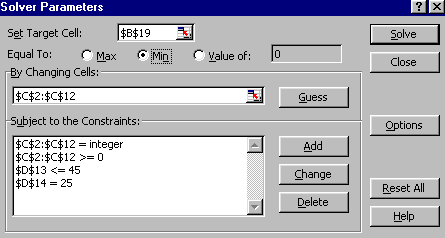
where the constraint D14=25 ensures that we stay feasible with a project completion time of 25. The solution obtained is shown below.
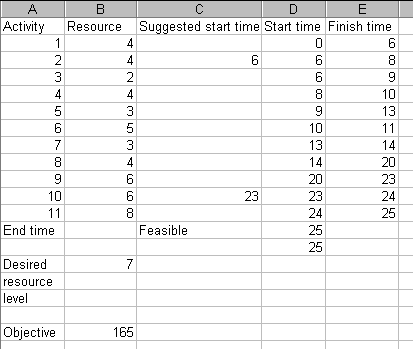
with the resource profile and Gantt chart being
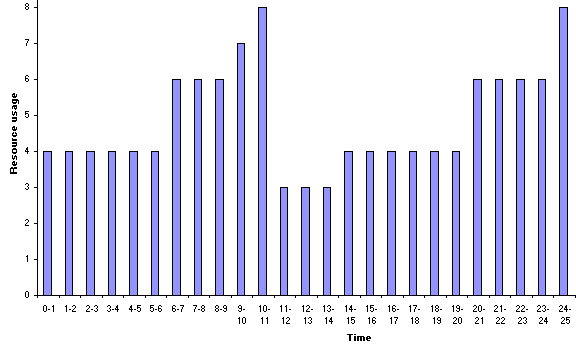
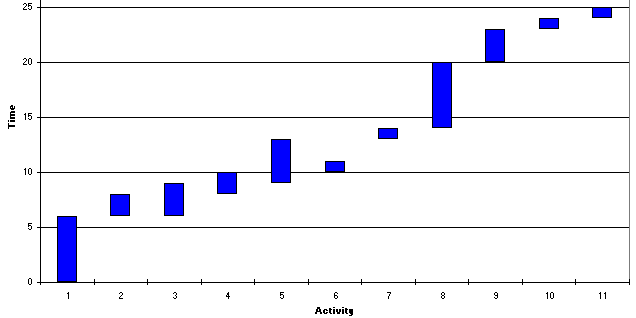
It can be seen from the start times given above that the smoothing process has made no difference to the times we had derived previously. However, we did not know this beforehand and consequently attempting smoothing has told us that the resource profile is already "as smooth" for a 25 week completion time as we can make it.