OR-Notes are a series of introductory notes on topics that fall under the broad heading of the field of operations research (OR). They were originally used by me in an introductory OR course I give at Imperial College. They are now available for use by any students and teachers interested in OR subject to the following conditions.
A full list of the topics available in OR-Notes can be found here.
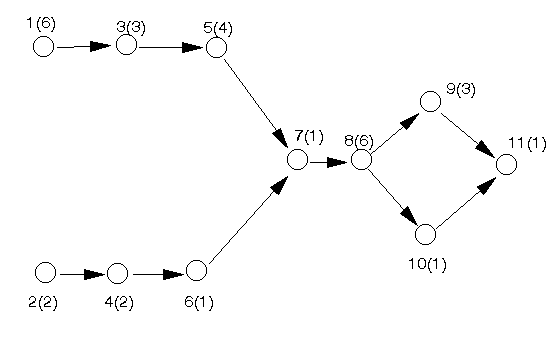
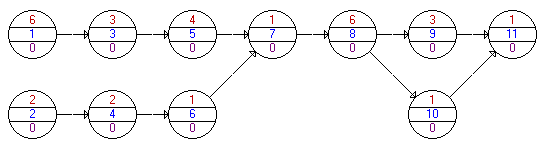
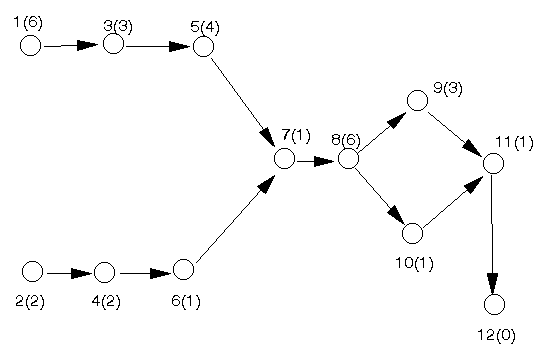
In the network diagram shown below, for the problem we considered before, each node (circle) represents an activity and is labelled with the activity number and the associated completion time (shown in brackets after the activity number).
This network is an activity on node (AON) network.
In constructing the network we:
One tip that I find useful in drawing such diagrams is to structure the positioning of the nodes (activities) so that the activities at the start of the project are at the left, the activities at the end of the project at the right, and the project "flows" from left to right in a natural fashion.
Once having drawn the network it is a relatively easy matter to analyse it (using a dynamic programming algorithm to find the critical path). However we will not consider this algorithm in any detail here but will instead use the computer package to solve the problem.
Note here one key point, the above network diagram assumes that activities not linked by precedence relationships can take place simultaneously (e.g. at the start of the project we could be doing activity 1 at the same time as we are doing activity 2).
Essentially the above diagram is not needed for a computer - a computer can cope very well (indeed better) with just the lists of activities and their precedence relationships we had before. The above diagram is intended for people. Consider what might happen in a large project - perhaps many thousands or tens of thousands of activities and their associated precedence relationships. Do you think it would be possible to list those out without making any errors? Obviously not - so how can we spot errors? Looking at long lists in an attempt to spot errors is just hopeless. With a little practice it becomes easy to look at diagrams such as that shown above and interpret them and spot errors in the specification of the activities and and their associated precedence relationships.
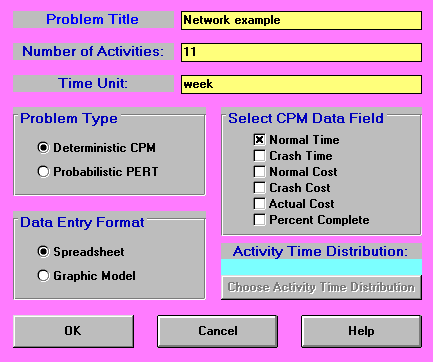
The problem (as represented by the network diagram) was solved using the package, the input being shown below. Note that we have chosen to enter the problem as a deterministic CPM problem. The various input options shown below will become more familiar to you as we progress.
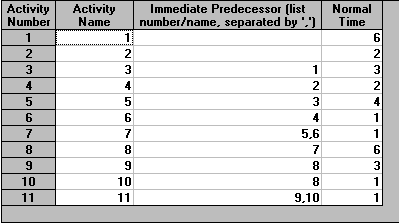
The numbers entered following the above screen are as below.
The output from the package is shown below.
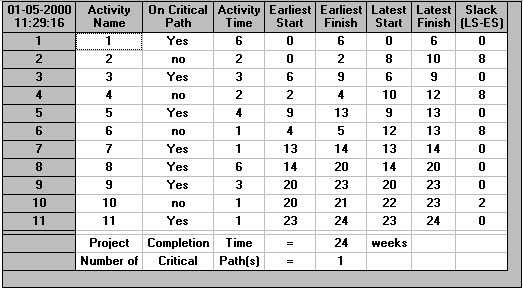
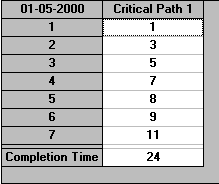
In the output we have a "Project Completion Time" of 24 (weeks). This means that if all the activities take exactly as long as expected the minimum time in which we can complete the project (complete all activities whilst obeying the precedence relationships) is 24 weeks.
Note here that we have (implicitly) assumed in calculating this figure of 24 weeks that we have sufficient resources to enable activities to be carried out simultaneously if required (e.g. activities 1 and 2 can be carried out simultaneously). Problems where this assumption does not hold are considered here.
In the column headed "Slack" we have, for each activity in turn, the amount of time that the activity can be delayed without altering (increasing) the overall project completion time. If delays occur in two or more activities then we must either analyse the effect on the project by hand, or rerun the problem with new data. Many textbooks also refer to slack by the term "float".
Activities with a slack of zero are called critical activities since they must all be completed on time to avoid increasing the overall project completion time. Hence, for this network, activities 1, 3, 5, 7, 8, 9 and 11 are the critical activities.
Note here that 1 3 5 7 8 9 11 constitutes a path in the network diagram from the initial node (node 1) to the final node (node 11). This is no accident because for any network there will always be a path of critical activities from the initial node to the final node. Such a path is called the critical path.
More strictly the definition of a critical path is a path of activities, each pair of activities in the path directly connected via a precedence relationship (arc), from the start (initial node) to the end (final node) of the project, where the completion times of the activities on the path sum to the overall minimum project completion time. All activities in this path must be critical by definition.
The output also lists, for each activity:
Note also:
Be warned that, both in the textbooks and in the literature, there are various different ways of performing network analysis presented - in particular:
We started out by trying to answer the key question:
What is the minimum possible time in which we can complete this project?
In the course of answering this question we have encountered a number of unexpected, but extremely useful, benefits. We now know:
It is clear that this information will be of great use in managing the project though to successful completion.
Moreover we, in drawing the network diagram, have had to THINK about our project. This process of thinking clearly and logically about the project is also of great benefit.
Note here that we have stressed managing the project through to successful completion. Network analysis is not magic. We cannot just draw the network, calculate the critical path and then go on holiday, returning when the project is scheduled to finish. The project must be managed to completion. However network analysis provides us with a vital technique for the successful management of the project.
Often we have to predict the effect on the project completion time of a change in an activity completion time. In general we have the table below indicating how the overall project completion time is affected by a change in the activity completion time.
                                       Activity
                             critical             non-critical
Activity completion      project completion     project completion
time increases by T      time increases by      time unaffected if
                         exactly T              T <= float

                                                project completion
                                                time increases by
                                                exactly (T-float)
                                                if T > float
Activity completion      project completion     project completion
time decreases by T      time may change        time unaffected
                         so recalculate
Note here that the above table only holds for a change in the completion time of a single activity. If completion times for two (or more) activities change the situation is more complex and we must recalculate the overall project completion time.
Note too here that if the activity completion time of a critical activity decreases we may for a small network (via inspection or logic) be able to see whether or not we need to recalculate. For example, if there is just one critical path and the completion time of a critical activity reduces by one time unit then (by logic) the completion time of the overall project must also reduce by one time unit.
The package used, whilst not as powerful as commercially available (and commercially priced) packages such as Microsoft Project does have a number of features that are also present in more expensive packages. For example we can get an automatic graphical representation of the problem from our spreadsheet input (do Format and Switch to Graphic Model). This is shown below.
In this activity on node graphic representation the notation used is that the centre number in each node is the activity name (a number in this case) and the upper number in each node is the activity duration.
Once we have solved the problem to determine the critical path we have a number of different options available from the Results menu.
Activity Criticality Analysis gives us the output shown previously above.
Graphic Activity Analysis gives us:
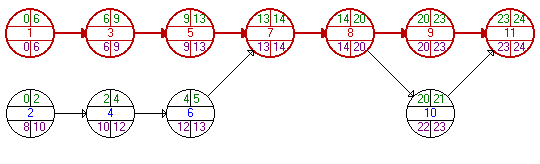
which shows the network (as before), but now with the earliest/latest start/finish times for each node (activity). Note that the times shown for each activity are ES, EF, LS, and LF (from left to right, from top to bottom).
Show Critical Path merely gives us a listing of the critical path as below.
Gantt Chart gives us the output below (note that the chart can be altered in size using Scale).
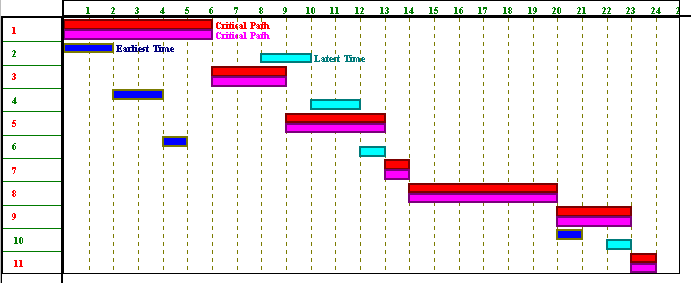
The Gantt chart was originated by H.L. Gantt in 1918. Here the package displays both the earliest and latest times for each activity and the critical path for the project (using suitable colours). In this output each activity has two horizontal bars. The first bar represents when it will take place if it is started at its earliest start time. The second bar represents when it will take place if it is scheduled at its latest start time. Obviously for critical activities the two bars are identical.
Gantt charts are quite commonly used. They provide an easy graphical representation of when activities (might) take place.
Note here that one thing which will become crucial if we go deeper into network analysis is the non-critical activities. In the above Gantt chart we can see that (within limits) we have a choice as to when non-critical activities start. For example activity 2 can start at times: 0,1,2,...,8 i.e. at any time between 0 and 8 without affecting the overall project completion time. We can say that there is a time window [0,8] within which activity 2 can be started without affecting the overall project completion time. As we have a choice as to when in this time window we start activity 2 then we have a DECISION to be made. Making appropriate decisions as to precisely when to start non-critical activities is a key feature of network analysis/project management.
Project Completion Analysis enables us to see the state of the project at any time. For example doing that analysis after 12 weeks (say) gives:
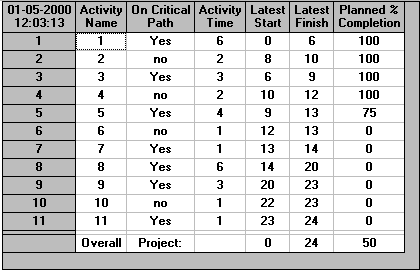
Here we can see that it is anticipated that after 12 weeks a number of activities (activities 1,2,3,4) will have all have been completed, activity 5 will have been 75% completed and the remaining activities not yet started. This analysis assumes:
Obviously in practice these assumptions may not be true.
Whilst being able to analyse a network via a computer using a package is obviously convenient we gain some additional insight if we could also analyse a network without the aid of a computer. In fact this is easily done.
Below we repeat the network diagram for the problem we were considering before. However note that we have now added a dummy activity (12) with a completion time of zero to represent the end of the project. This just makes the calculations we have to do easier to follow
In order to analyse this network without the aid of a computer package we first calculate, for each node (activity) in the network, the earliest start time for that activity such that all preceding activities have been finished. We do this below.
Let Ei represent the earliest start time for activity i such that all its preceding activities have been finished. We calculate the values of the Ei (i=1,2,...,12) by going forward, from left to right, in the network diagram..
To ease the notation let Ti be the activity completion time associated with activity i (e.g. T5 = 4). Then the Ei are given by:
E1 = 0 (assuming we start at time zero)
E2 = 0 (assuming we start at time zero)
E3 = E1 + T1 = 0 + 6 = 6
E4 = E2 + T2 = 0 + 2 = 2
E5 = E3 + T3 = 6 + 3 = 9
E6 = E4 + T4 = 2 + 2 = 4
E7 = max[E5 + T5, E6 + T6]
= max[9 + 4, 4 + 1] = 13
E8 = E7 + T7 = 13 + 1 = 14
E9 = E8 + T8 = 14 + 6 = 20
E10 = E8 + T8 = 14 + 6 = 20
E11 = max[E9 + T9, E10 + T10]
= max[20 + 3, 20 + 1] = 23
E12 = E11 + T11 = 23 + 1 = 24
Hence 24 (weeks) is the minimum time needed to complete all the activities and hence is the minimum overall project completion time.
Note here that the formal definition of the earliest start times is given by:
Ej = max[Ei + Ti | i one of the activities linked to j by an arc from i to j]
This equation for calculating Ej is actually a formal statement of the dynamic programming algorithm for the problem.
Conceptually we can think of this algorithm as finding the length of the longest path in the network (consider walking from the left-hand side of the network, to the right-hand side, through the nodes, where the completion time at each node indicates how long we must wait at the node before we can move on). However, because of the risk of error, we should always carry out the above calculation explicitly, rather than relying on the eye/brain to inspect the network to spot the longest path in the network. This inspection approach is infeasible anyway for large networks.
As well as the minimum overall project completion time calculated above we can extract additional useful information from the network diagram by the calculation of latest start times. We deal with this below.
Let Li represent the latest time we can start activity i and still complete the project in the minimum overall completion time. We calculate the values of the Li (i=1,2,...,12) by going backward, from right to left, in the network diagram. Hence:
L12= 24
L11 = L12 - T11 = 24 - 1 = 23
L10 = L11 - T10 = 23 - 1 = 22
L9 = L11 - T9 = 23 - 3 = 20
L8 = min[L9 - T8, L10 - T8]
= min[20 - 6, 22 - 6] = 14
L7 = L8 - T7 = 14 - 1 = 13
L6 = L7 - T6 = 13 - 1 = 12
L5 = L7 - T5 = 13 - 4 = 9
L4 = L6 - T4 = 12 - 2 = 10
L3 = L5 - T3 = 9 - 3 = 6
L2 = L4 - T2 = 10 - 2 = 8
L1 = L3 - T1 = 6 - 6 = 0
The formal definition of the latest start times is given by:
Li = min[Lj - Ti | j one of the activities linked to i by an arc from i to j]
Note that as a check that we have done both the earliest start times and latest start times calculations correctly we have:
In fact (as with the package solution) using the latest start times Li and the concept of float we can identify which activities are critical in the above network in the sense that if a critical activity takes longer than its estimated completion time the overall project completion time will increase. We deal with this below.
As we know the earliest start time Ei, and latest start time Li, for each activity i it is clear that the amount of slack or float time Fi available is given by Fi = Li - Ei which is the amount by which we can increase the time taken to complete activity i without changing (increasing) the overall project completion time. Hence we can form the table below:
Activity   Li          Ei           Float Fi
1          0           0            0
2          8           0            8
3          6           6            0
4         10           2            8
5          9           9            0
6         12           4            8
7         13           13           0
8         14           14           0
9         20           20           0
10        22           20           2
11        23           23           0
Any activity with a float of zero is critical. Note here that, as a check, all float values should be >= 0 and that these float values are the same as those derived by the package.
The float figures derived are known as also known as total float. As in the above example a "chain" of successive activities (in this case 2, 4 and 6) share the same float and this is common with total float.
Two other varieties of float (for non-critical activities) are also conventionally distinguished:
where here by delay we strictly mean "the increase in completion time".
The effect of the free float calculation is to "push" the total float associated with a chain of successive non-critical activities onto the last activity in the chain. The significance of independent float is that it is associated solely with one activity and not with a chain of two or more activities.
With regard to calculating free and independent float we have that convenient formulae are:
Recalling the table we calculated above (and adding latest finish = latest start + completion time, and earliest finish = earliest start + completion time) we have:
Activity   Latest   Earliest   Latest   Earliest   Completion
           start    start      finish   finish     time
1          0        0          6        6          6
2          8        0          10       2          2
3          6        6          9        9          3
4         10        2          12       4          2
5          9        9          13       13         4
6         12        4          13       5          1
7         13        13         14       14         1
8         14        14         20       20         6
9         20        20         23       23         3
10        22        20         23       21         1
11        23        23         24       24         1
and recalling the network diagram
we have that free and independent float (for the non-critical activities) are:
Activity   Free float   Independent float
2          0            0
4          0            0
6          8            0
10         2            2
As commented before free float pushes the total float associated with a chain of successive activities onto the last activity in the chain. Activity 10, as it is by itself and not in a chain of non-critical activities, has a free float of 2 (= its previously calculated total float), as well as an independent float of 2.
So far we have dealt solely with simple activity dependencies (such as A must be finished before B can start). It is relatively simple to deal with more complicated dependencies such as those considered below. Note here however that professional project management packages typically hide the details of incorporating such dependencies into the network from the user.
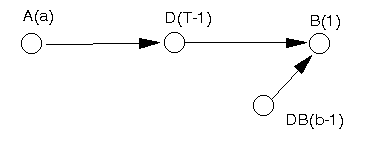
In the notation below A and B are two activities with completion times a and b. Activities starting with a D are "dummy" activities introduced in order to correctly represent the activity dependency.
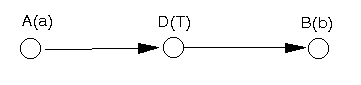
In this case the dummy activity between A and B imposes the appropriate time lag.
Note here that we have used the phrase "at least T" above. If we wished to impose a delay of precisely T then, in fact, we cannot do this in any general sense in the network diagram, instead we need to approach the network via linear programming. The same comment applies to the other examples given below.
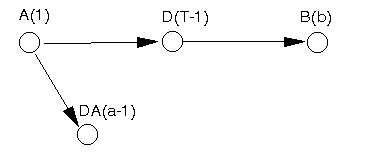
In this case we break activity A into two activities. The first (labelled A above) indicates that A has started. The second (labelled DA above) represents the continuation of activity A once it has started. The dummy activity D imposes the appropriate time lag of T between the start of A and the start of B. Note here that the time unit of 1 used above in A(1) and D(T-1) is purely arbitrary, we could have used any small time unit > 0 to achieve the same effect.
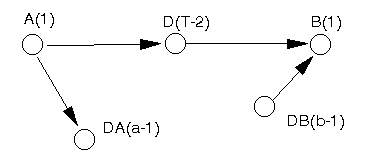
In this case we break B into two activities. The first (labelled B above) represents the end of B. The second (labelled DB above) represents the start of B. The dummy activity D imposes the appropriate time lag of T between the end of A and the end of B.
This case combines features we have already seen above. A is broken into two activities, one representing its start (labelled A above) and the other its continuation (labelled DA above). B is broken into two activities, one representing its end (labelled B above) and the other representing the start of B (labelled DB above). The dummy activity D imposes the appropriate time lag of T between the start of A and the end of B.
The table below defines the activities within a small project.
Activity        Completion time   Immediate predecessor
                (weeks)           activities
    A           3                  -
    B           1                  A
    C           2                  B,A
    D           7                  -
    E           8                  D,A
    F           3                  B
    G           1                  E,F
    H           2                  D
The network diagram is shown below. Note the introduction of a dummy activity I with a duration of zero to represent the end of the project.
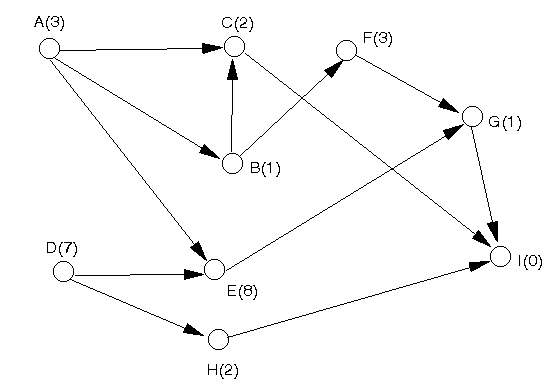
Note here that the arc AC is redundant here, since it is implied by the arcs AB and BC. However, in general, it is easier to leave redundant arcs in the network rather than run the risk of making a mistake by deleting them.
Let Ei represent the earliest start time for activity i such that all its preceding activities have been finished. We calculate the values of the Ei (i=A,B,...,I) by going forward, from left to right, in the network diagram.
To ease the notation let Ti be the activity completion time associated with activity i (e.g. TB = 1). Then the Ei are given by:
EA = 0 (assuming we start at time zero)
ED = 0 (assuming we start at time zero)
EB = EA + TA = 0 + 3 = 3
EH = ED + TD = 0 + 7 = 7
EC = max[EA + TA, EB + TB]
= max[0 + 3, 3 + 1] = 4
EE = max[EA + TA, ED + TD]
= max[0 + 3, 0 + 7] = 7
EF = EB + TB = 3+ 1 = 4
EG = max[EF + TF, EE + TE]
= max[4 + 3, 7 + 8] = 15
EI = max[EC + TC, EG + TG,
EH + TH] = max[4 + 2, 15 + 1, 7 + 2] = 16
Hence the minimum possible completion time for the entire project is 16 weeks i.e. 16 (weeks) is the minimum time needed to complete all the activities.
We now need to calculate the latest times for each activity.
Let Li represent the latest start time we can start activity i and still complete the project in the minimum overall completion time. We calculate the values of the Li (i=A,B,...,I) by going backward, from right to left, in the network diagram. Hence:
LI = 16
LG= LI - TG = 16 - 1 = 15
LC = LI - TC = 16 - 2 = 14
LH = LI - TH = 16 - 2 = 14
LF = LG - TF = 15 - 3 = 12
LE = LG - TE = 15 - 8 = 7
LB = min[LC - TB, LF - TB]
= min[14 - 1, 12 - 1] = 11
LA = min[LC - TA, LB - TA,
LE - TA] = min[14 - 3, 11 - 3, 7 - 3] = 4
LD = min[LE - TD, LH - TD]
= min[7 - 7, 14 - 7] = 0
Note that as a check all latest times are >=0 at least one activity has a latest start time value of zero.
As we know the earliest start time Ei, and latest start time Li, for each activity i it is clear that the amount of slack or float time Fi available is given by Fi = Li - Ei which is the amount by which we can increase the time taken to complete activity i without changing (increasing) the overall project completion time. Hence we can form the table below:
Activity   Li          Ei           Float Fi
A          4           0             4
B         11           3             8
C         14           4            10
D          0           0             0
E          7           7             0
F         12           4             8
G         15           15            0
H         14           7             7
Any activity with a float of zero is critical. Note here that, as a check, all float values should be >= 0.
Hence the critical activities are D, E and G and the floats for the non-critical activities are given in the table above.
Some more network analysis activity on node examples can be found here.