OR-Notes are a series of introductory notes on topics that fall under the broad heading of the field of operations research (OR). They were originally used by me in an introductory OR course I give at Imperial College. They are now available for use by any students and teachers interested in OR subject to the following conditions.
A full list of the topics available in OR-Notes can be found here.
We deal here with two different types of facility layout problem:
We shall consider each type in turn by means of an example.
Consider a company whose current departmental layout is as below. Here we have eleven departments, labelled 1 to 9 and A to B. We regard the factory floor as being divided, by rows and columns, into individual (equally sized and square/rectangular) cells, as on a chess board.
        Column
        1 2 3 4 5 6 7 8 9 0 1 2 3 4
Row  1  1 1 1 1 1 1 2 3 3 3 3 3 3 3
     2  1 1 1 1 1 1 2 3           3
     3  8 8 8 8 8 8 8 3           3
     4  8           8 3 3 3 3 3 3 3
     5  8           8 5 5 4 4 4 4 4
     6  8           8 5 5 4       4
     7  8           8 6 6 4       4
     8  8           8 6 6 4       4
     9  8           8 7 7 4       4
    10  8           8 7 7 4 4 4 4 4
    11  8           8 A A A A B B B
    12  8 8 8 8 8 8 8 A     A B   B
    13  9 9 9 9 9 9 9 A     A B   B
    14  9           9 A     A B   B
    15  9           9 A     A B   B
    16  9 9 9 9 9 9 9 A A A A B B B
The dimensions of these eleven departments can be deduced from the above, for example department 9 runs from row 13 to row 16 (inclusive) and from column 1 to column 7 (inclusive). What we are interested in doing is in changing the layout shown above into one that may be more effective.
A key point to note here is that in considering any possible layout changes we have some rules:
What can be altered though is:
In order to logically lay out departments we need to measure the flow or interaction between departments - logically departments between which there is a large flow should be closer to each other than departments between which there is a small flow.
This flow typically represents the amount of material flowing between departments in the production process.
Informally therefore we would like to arrange (layout) departments so as to minimise the sum over all pairs i and j of departments (distance between i and j) multiplied by (flow between i and j). This product is sometimes generically called a load-distance score. The flows between pairs of departments for the example we are considering here are shown below.
         To
         1    2   3    4   5   6   7    8   9   A   B
From 1   -    -   -    -   30  -   20   -   -   -   -
     2   -    -   40   -   -   -   -    10  -   -   -
     3   100  -   -    -   -   -   -    40  50  30  -
     4   -    -   -    -   -   5   -    -   -   -   150
     5   -    40  -    -   -   80  -    30  90  -   -
     6   10   30  30   20  10  -   90   -   -   10  -
     7   -    -   40   100 -   -   -    -   -   -   20
     8   10   -   -    30  -   40  -    -   50  60  -
     9   10   -   -    50  -   40  -    30  -   40  -
     A   15   20  -    80  70  30  -    10  -   55  -
     B   -    -   -    10  -   20  -    -   -   -   -
Note that in our example this flow matrix is symmetric (flow from i to j the same as flow to j to i) but in general it need not be symmetric.
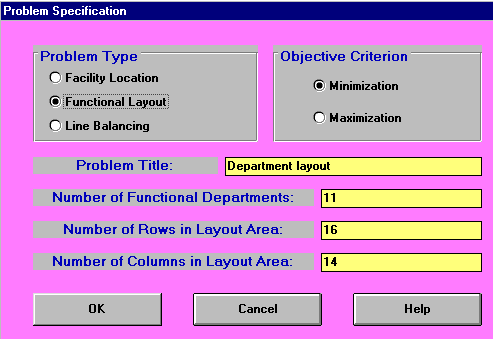
This problem can be solved using the package, the input being shown below.


Note that the initial position for each department is set by giving the (row, column) positions of diagonally opposite corners in each department. For example department 1 runs from (1,1) - (row 1, column 1) to (2,6) - (row 2 column 6). Note that the package used here requires that the ordinary brackets ( and ) are used in inputting the initial layout - using the square brackets [ and ] will not work.
Now in solving the problem we need to specify an appropriate distance model. This is because as we do not yet know where the departments are to be in an improved layout we cannot specify the distance between them without a general expression for calculating the distance between two locations.
If (xi,yi) and (xj,yj) represent the coordinates of two locations i and j then the distance model measures can be:
The rectilinear distance measure is often used for factories, American cities, etc which are laid out in the form of a rectangular grid. For this reason it is sometimes called the Manhattan distance measure. The Euclidean distance measure is used where genuine straight line travel is possible. The squared Euclidean distance measure is used where straight line travel is possible but where we wish to discourage excessive distances (squaring a large distance number results in an even larger distance number and we use the distance number in the objective which we are trying to minimise).
The choice of which distance measure to use usually grows from the physical restrictions on movement in the situation being considered.
The output from the package is shown below (using the rectilinear distance measure as the measure of distance between departments).
This output was obtained by using the solve option relating to (simultaneously) exchanging 2 departments, as below.
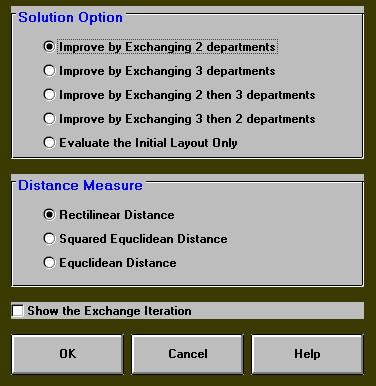
Here the package seeks a better layout by attempting to exchange (if possible) the current positions of two departments. When no more exchanges which improve the solution value can be found the package terminates.
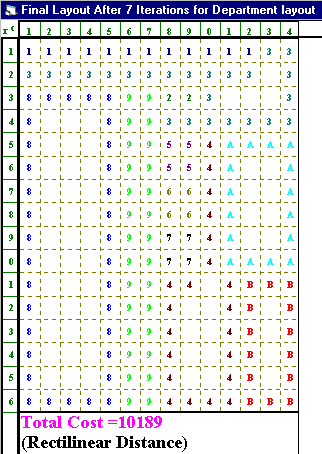
This final layout is also shown below.
      1 2 3 4 5 6 7 8 9 0 1 2 3 4
   1  1 1 1 1 1 1 1 1 1 1 1 1 3 3
   2  3 3 3 3 3 3 3 3 3 3 3 3   3
   3  8 8 8 8 8 9 9 2 2 3       3
   4  8       8 9 9 3 3 3 3 3 3 3
   5  8       8 9 9 5 5 4 A A A A
   6  8       8 9 9 5 5 4 A     A
   7  8       8 9 9 6 6 4 A     A
   8  8       8 9 9 6 6 4 A     A
   9  8       8 9 9 7 7 4 A     A
  10  8       8 9 9 7 7 4 A A A A
  11  8       8 9 9 4 4 4 4 B B B
  12  8       8 9 9 4     4 B   B
  13  8       8 9 9 4     4 B   B
  14  8       8 9 9 4     4 B   B
  15  8       8 9 9 4     4 B   B
  16  8 8 8 8 8 9 9 4 4 4 4 B B B
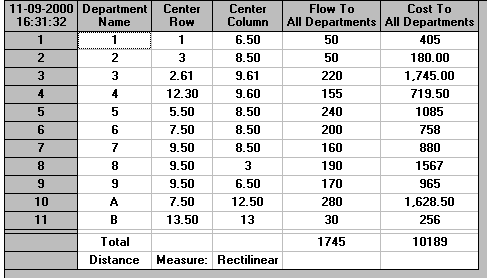
With a cost of 10189 this layout improves substantially on our initial layout (which has a cost of 14147.5). The package produces this total cost of 10189 by assuming that each department is located at its centre and then uses the rectilinear distance between these centres to compute a load-distance score. This can be seen in some detail below. In the output below department 1 is centred at row 1, as seems natural since all cells in that department are in row 1. The centre column is 6.5. Department 1 runs from column 1 to column 12 inclusive. Putting the centre of the department at 6.5 means that there are 6 cells in the department to the left of this centre, 6 cells in the department to the right of this centre.
Note here that we may get a better solution if we take one or more of the other solve options (as we have four options):
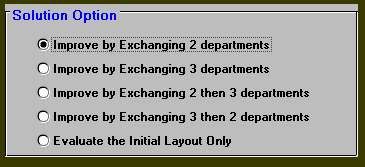
For this particular example the option of "Improve by Exchanging 3 then 2 departments" leads to an improved layout as below.
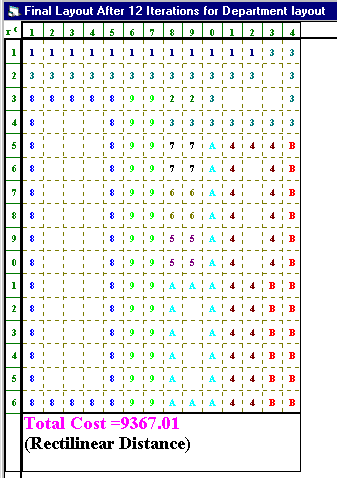
Typically what happens in layout problems is that one looks at the layouts produced and concentrates on major departments. In both of the rectilinear layouts produced above for example department 1 is located at the top in a long line. Whilst we may be happy with the general location for this department we may (for other reasons) prefer its original shape, as a 2 row, 6 column department instead of the computer generated shape of a 1 row 12 column department.
To incorporate our preference we can simply fix this department into position and resolve. If this is done the best solution now is as below (found by "Improve by Exchanging 3 then 2 departments").
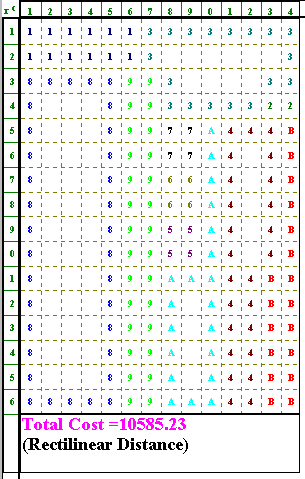
Proceeding in this way we can work towards a layout with which we are happy and which has been developed with the aid of a quantitative consideration of the factors (flow and distance) that we are interested in.
In assembly line balancing we attempt to arrange (layout!) individual work elements (tasks) into groups (or workstations) so that, ideally, each workstation is never idle.
To illustrate the problem consider the following example: a company is setting up an assembly line to produce a certain unit. The assembly line for the production of this unit involves 10 work elements where the times for each work element, and the immediate successor work elements are:
Work      Time     Immediate
element   seconds  successors
1         40       2,3 (i.e. work elements 2 and 3 cannot be started
                        until work element 1 has been completed)
2         30       4,5
3         50       6,7
4         40       8
5          6       8
6         25       9
7         15       9
8         20       10
9         18       10
10        30       -
A diagrammatic representation of the work elements and these successor relationships is given below.
One possible workstation layout (involving three workstations) is shown below. In that figure tasks within a workstation are done sequentially (one after another) by (typically) a single operator. However the workstations are working in parallel i.e. at the same time as work is being done at workstation number 1 (WS1), work is also being done at workstation number 2 (WS2) and workstation number 3 (WS3).
Note here that in the figure below the workstation order, and the sequence of work within each workstation, are such as to satisfy the successor relationships (technological restrictions) stated before.
In the workstation arrangement above the total work element time for WS1 is 120 seconds, for WS2 it is 66 seconds and for WS3 it is 88 seconds. The idea is that the workstations pass material between themselves "in step" (all at the same time).
Hence at exactly the same moment in time:
As we pass on "in step" we cannot pass on until ALL workstations have finished. This "in step" strategy has two advantages:
since no workstation can pass on until the next workstation is free. This is the type of strategy adopted in a JIT (Just-in-Time) manufacturing environment.
Typically workstations are physically close together so that the time spent "passing on in step" is small and can be regarded as being the same for WS1 to WS2 as for WS2 to WS3.
Note here that, provided the workstation layout shown above satisfies the technological constraints relating to successor relationships between work elements (in fact it does), we have a solution to our assembly line problem which involves three workstations and produces one completed unit every 120 seconds (question - why only one completed unit every 120 seconds? - answer, the "in step" rule means that the system progresses at the speed of the slowest workstation and so that regulates the output of the system)
Question - suppose we allocate work element 2 to WS2 - how often now do we pass on?
Question - what conceptually would be ideal allocation of work of workstations?
Suppose now that we wish to make 60 units per hour, then we need to produce one unit every (3600/60) seconds i.e. one unit every 60 seconds. This figure of 60 seconds is the cycle time.
Conceptually we can think of the assembly line being divided (somehow) into workstations. Every 60 seconds (the cycle time) one unit of partially processed material is passed from one workstation to the next workstation.
The total work element time is 40 + 30 + ... + 18 + 30 = 274 seconds. Hence we need at least 274/60 = 4.6 workstations to ensure that one unit of fully processed material emerges every 60 seconds, i.e. at least 5 workstations are needed to achieve the cycle time we desire.
Note here that there is no guarantee that if we have 5 workstations we will achieve the required cycle time (due to the technological constraints as represented by the successor relationships).
This assembly line balancing problem can be solved using the package, with the input being shown below.
Note here that in this input an isolated task is a task that can be done anywhere in the production process (i.e. it has no predecessors or successors) but (obviously) must be done somewhere.
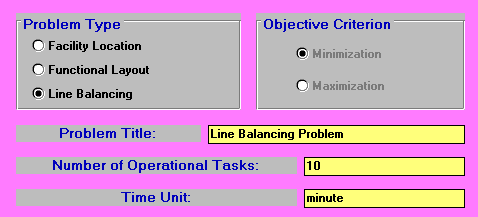
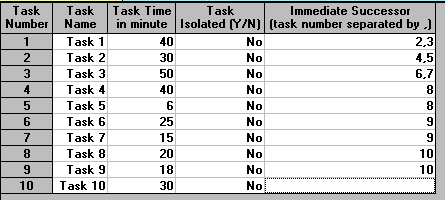
The output is shown below. The solution method chosen ("Optimizing Best Bud Search") guarantees to find a solution involving the minimum number of workstations that can be used, having regard to the cycle time and the technological (successor) constraints.

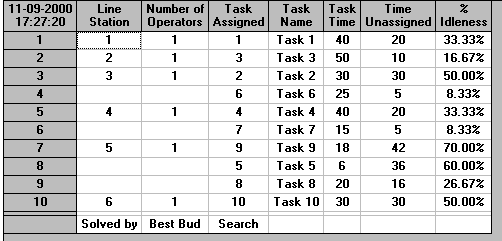
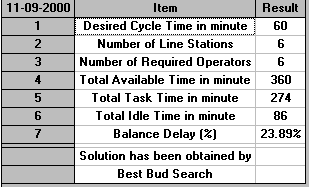
A diagrammatic representation of the work elements involved in the various workstations for the solution shown above is given below. Note here that the order for processing is first workstation 1, involving work element 1; then workstation 2, involving work element 3; then workstation 3, involving work elements 2 and 6; etc.
From the package output the solution involves 6 workstations, each with 60 seconds (the cycle time) available per cycle. This gives a total available time of 6x60 = 360 seconds.
The total work element time is 274 seconds so the total idle time is 360 - 274 = 86 seconds (per cycle). Hence (274/360)x100 = 76.11% of the total available time is used for production, this is known as the cycle efficiency and (86/360)x100 = 23.89% of the total available time is idle time and this is known as the balance delay.
Ideally the balance delay would be zero (i.e. each workstation never has an idle moment in a cycle). One way to reduce balance delay is to try different cycle times.
Below we show the package output for a desired production rate of 65 per hour (cycle time 55 seconds).
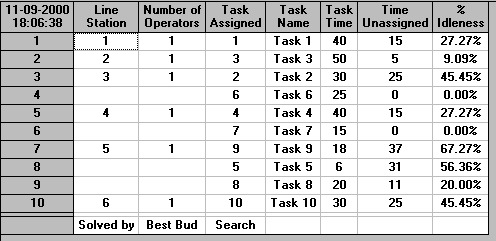
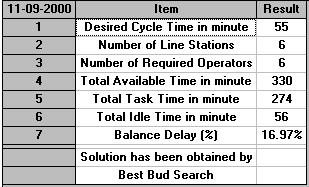
Below we show the package output for a desired production rate of 45 per hour (cycle time 80 seconds).
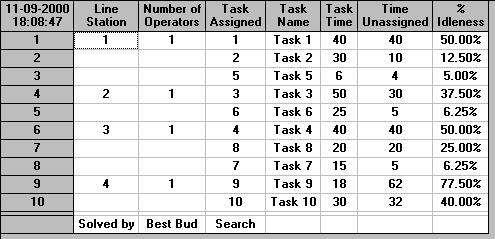
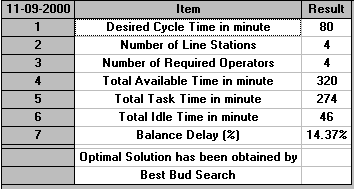
Which of the solutions shown so far (for cycle times of 55, 60 and 80) do you prefer?
Note here that for a given number of workstations and a given cycle time the total idle time is fixed (equal to number of workstations multiplied by the cycle time minus the total task time) and hence what is of importance is not the total idle time but how it is distributed between workstations.
One example of facility layout that I have been involved in was to do with check-in desk allocation in Terminal 3 (usually referred to as T3) at Heathrow airport for British Airports Authority (BAA), the operators of Heathrow. T3 is used solely for international (mostly long-haul) flights.
At the time of this study T3 had 134 check-in desks arranged in 5 cul-de-sacs (denoted by A to E respectively). A diagrammatic representation of the check-in area is given below.
--------------------------------------------------------
xd        dxd        dxd        dxd        dxd        dx
xd        dxd        dxd        dxd        dxd        dx
xd        dxd        dxd        dxd        dxd        dx
xd        dxd        dxd        dxd        dxd        dx
xd        dxd        dxd        dxd        dxd        dx
xd   A    dxd   B    dxd    C   dxd    D   dxd    E   dx

d is a check-in desk area, x a baggage conveyor area
Cul-de-sac's A and E had 28 check-in desks, cul-de-sacs B, C and D had 26 check-in desks. For various reasons too complex to explain here the desks were effectively allocated to a single airline (or handling agent). For example cul-de-sac A was allocated to American Airlines (AA) and Saudi Airlines (SV). This meant that, even when these airlines had no flights scheduled, the check-in desks were not available to be used by other airlines.
Now from the airport operators point of view check-in is not where they make money from passengers, that occurs after they check-in, in the duty-free area, the restaurants and shops. Also many of the problems of operating an airport come down to managing fixed capacity well. There are only so many check-in desks, only so many terminals, only so many runways, etc.
The point of this study was to see what could be gained if BAA effectively took control of the desks and allocated them to airlines on a time basis (the allocation changing every half-hour). Effectively the flight schedule repeats on a weekly basis so BAA needed an algorithm that would allocate each of the 134 check-in desks, seven days a week, by half-hour periods.
The key question that needs to be answered before attempting to allocate desks is: How many desks does each airline actually need? Obviously an airline would like as many desks as possible - this gives them maximum flexibility and also means their competitors cannot have the desks!
To answer this question logically we need to consider factors like:
Airports are data-rich environments and data was not a problem in this study.
The last factor queueing time at check-in is a key one. For example suppose airline X is twice as quick at processing passengers checking in as airline Y. Does this mean that BAA should allocate X only half as many desks as Y? To do so would be to penalise efficiency and the solution adopted was to set a standard for queueing time (the same for all airlines) and to allocate desks based on this standard. As BAA was only concerned with desk allocation (airlines could choose to man the desks or not!) airlines which were more efficient than the standard could use less personnel and/or have shorter queueing times, airlines which were less efficient than the standard would have longer queueing times.
The algorithmic solution I adopted was a heuristic algorithm which built up a check-in desk allocation pattern over the course of time. It used a number of rules and restrictions not detailed here.
The diagram below shows example output from that algorithm for cul-de-sac A (desks A1 to A28) on day 1 (Monday) over 24 hours at half-hour intervals. Recall that cul-de-sac A was shared between AA and SV. You will see in the diagram below how the desks are allocated over time to AA and SV. building up as their flights build up and falling off as their flights fall off. For example at 5am AA is allocated three desks A1 to A3, at 5.30am there are allocated one more desk (A4), at 6am three more desks (A5 to A7), etc. Note too how some desks (e.g. desk A23) are allocated to one than one airline.
   HOUR 4     5     6     7     8     9    10    11    12    13    14    15    16    17    18    19    20    21    22    23    24
  A1    -- -- AA AA AA AA AA AA AA AA AA AA AA AA AA AA AA AA AA AA AA AA AA AA AA AA -- -- -- -- -- -- -- -- -- -- -- -- -- -- --
  A2    -- -- AA AA AA AA AA AA AA AA AA AA AA AA AA AA AA AA AA AA AA AA AA AA AA -- -- -- -- -- -- -- -- -- -- -- -- -- -- -- --
  A3    -- -- AA AA AA AA AA AA AA AA AA AA AA AA AA AA AA -- -- -- AA AA AA AA AA -- -- -- -- -- -- -- -- -- -- -- -- -- -- -- --
  A4    -- -- -- AA AA AA AA AA AA AA AA AA AA AA AA AA -- -- -- -- -- AA AA AA -- -- -- -- -- -- -- -- -- -- -- -- -- -- -- -- --
  A5    -- -- -- -- AA AA AA AA AA AA AA AA AA AA AA AA -- -- -- -- -- -- AA AA -- -- -- -- -- -- -- -- -- -- -- -- -- -- -- -- --
  A6    -- -- -- -- AA AA AA AA AA AA AA AA AA -- AA AA -- -- -- -- -- -- AA AA -- -- -- -- -- -- -- -- -- -- -- -- -- -- -- -- --
  A7    -- -- -- -- AA AA AA AA AA AA AA AA -- -- AA AA -- -- -- -- -- -- -- -- -- -- -- -- -- -- -- -- -- -- -- -- -- -- -- -- --
  A8    -- -- -- -- -- AA AA AA AA AA AA AA -- -- -- -- -- -- -- -- -- -- -- -- -- -- -- -- -- -- -- -- -- -- -- -- -- -- -- -- --
  A9    -- -- -- -- -- AA AA AA AA AA AA AA -- -- -- -- -- -- -- -- -- -- -- -- -- -- -- -- -- -- -- -- -- -- -- -- -- -- -- -- --
  A10   -- -- -- -- -- AA AA AA AA AA AA AA -- -- -- -- -- -- -- -- -- -- -- -- -- -- -- -- -- -- -- -- -- -- -- -- -- -- -- -- --
  A11   -- -- -- -- -- AA AA AA AA AA AA AA -- -- -- -- -- -- -- -- -- -- -- -- -- -- -- -- -- -- -- -- -- -- -- -- -- -- -- -- --
  A12   -- -- -- -- -- AA AA AA AA AA AA AA -- -- -- -- -- -- -- -- -- -- -- -- -- -- -- -- -- -- -- -- -- -- -- -- -- -- -- -- --
  A13   -- -- -- -- -- AA AA AA AA AA AA -- -- -- -- -- -- -- -- -- -- -- -- -- -- -- -- -- -- -- -- -- -- -- -- -- -- -- -- -- --
  A14   -- -- -- -- -- -- AA AA AA AA AA -- -- -- -- -- -- -- -- -- -- -- -- -- -- -- -- -- -- -- -- -- -- -- -- -- -- -- -- -- --
  A15   -- -- -- -- -- -- AA AA AA AA AA -- -- -- -- -- -- -- -- -- -- -- -- -- -- -- -- -- -- -- -- -- -- -- -- -- -- -- -- -- --
  A16   -- -- -- -- -- -- AA AA AA AA AA -- -- -- -- -- -- -- -- -- -- -- -- -- -- -- -- -- -- -- -- -- -- -- -- -- -- -- -- -- --
  A17   -- -- -- -- -- -- AA AA AA AA AA -- -- -- -- -- -- -- -- -- -- -- -- -- -- -- -- -- -- -- -- -- -- -- -- -- -- -- -- -- --
  A18   -- -- -- -- -- -- AA AA AA AA AA -- -- -- -- -- -- -- -- -- -- -- -- -- -- -- -- -- -- -- -- -- -- -- -- -- -- -- -- -- --
  A19   -- -- -- -- -- -- AA AA AA AA AA -- -- -- -- -- -- -- -- -- -- -- -- -- -- -- -- -- -- -- -- -- -- -- -- -- -- -- -- -- --
  A20   -- -- -- -- -- -- -- AA AA AA -- -- -- -- -- -- -- -- -- -- -- -- -- -- -- -- -- -- SV -- -- -- -- -- -- -- -- -- -- -- --
  A21   -- -- -- -- -- -- -- AA AA AA -- -- -- -- -- -- -- -- -- -- -- -- -- -- -- -- -- -- SV SV SV -- -- -- -- -- -- -- -- -- --
  A22   -- -- -- -- -- -- -- AA AA AA -- -- -- -- -- -- -- -- -- -- -- -- -- -- -- -- SV SV SV SV SV -- -- -- -- -- -- -- -- -- --
  A23   -- -- -- -- -- -- -- AA AA AA -- -- -- -- -- -- -- -- -- -- -- -- -- -- SV SV SV SV SV SV SV -- -- -- -- -- -- -- -- -- --
  A24   -- -- -- -- -- -- -- -- AA -- -- -- -- -- -- -- -- -- -- -- -- -- -- -- SV SV SV SV SV SV SV -- -- -- -- -- -- -- -- -- --
  A25   -- -- -- -- -- -- -- -- -- -- -- -- -- -- -- -- -- -- -- -- -- -- -- -- SV SV SV SV SV SV SV SV -- -- -- -- -- -- -- -- --
  A26   -- -- -- -- -- -- -- -- -- -- -- -- -- -- -- -- -- -- -- -- -- -- -- -- SV SV SV SV SV SV SV SV -- -- -- -- -- -- -- -- --
  A27   -- -- -- -- -- -- -- -- -- -- -- -- -- -- -- -- -- -- -- -- -- -- -- -- -- -- -- -- -- -- -- -- -- -- -- -- -- -- -- -- --
  A28   -- -- -- -- -- -- -- -- -- -- -- -- -- -- -- -- -- -- -- -- -- -- -- -- -- -- -- -- -- -- -- -- -- -- -- -- -- -- -- -- --
Note the number of times above above when desks are not allocated to an airline. There is a lot of spare check-in desk capacity in this cul-de-sac on this day. This could potentially be used for other airlines. More airlines using T3 means more money for BAA and better use of their fixed capacity.