
On singular limits
Dealing with singular perturbation problems on a very regular basis, I cannot help but share with you the “layman” description of singular limits, offered by Sir Michael Berry:
Biting into an apple and finding a maggot is unpleasant enough, but finding half a maggot is worse. Discovering one-third of a maggot would be more distressing still: The less you find, the more you might have eaten. Extrapolating to the limit, an encounter with no maggot at all should be the ultimate bad-apple experience. This remorseless logic fails, however, because the limit is singular: A very small maggot fraction (f << 1) is qualitatively different from no maggot (f = 0). Limits in physics can be singular too — indeed they usually are — reflecting deep aspects of our scientific description of the world.
The rest of the article can be found in Physics Today, 55(5), pp. 10–11, doi:10.1063/1.1485555 (2002).
On improving the logo of the London Mathematical Society
The London Mathematical Society (LMS) is one of the oldest learned societies for mathematics in the UK. Pretty much everyone who is (or has been) anyone in the British mathematics is a member of this society. On this particular occasion, I am not particularly interested in the society itself, only in its logo, which looks like this:

I tried searching for a description or an interpretation of this logo on the LMS website, but to no avail. In fact, while browsing the website I found a page with an alternative sketch of the logo, which may (or may not) indicate that LMS may have had several different logos during its history. But this takes us too far off the track.
Despite the pleasing simplicity and symmetry of the current logo, I long felt that it appears somewhat plain in this day and age. Would it not be great to have some kind of new, shiny, three-dimensional logo, which would, somehow, still continue the traditions of the old one? I was also thinking that it would be important to preserve the mathematical identity of the logo. Hence, I began by starting up Maple and experimenting with parametric curves until I could came up with the following formulae: x=cos(7t)-3 sin(3t) and y=sin(7t)-3 cos(3t), where t changes from 0 to 4π. The Maple can be easily employed to plot this curve using the command input:
> plot([cos(7*t)-3*sin(3*t),sin(7*t)-3*cos(3*t),t=0..4*Pi],numpoints=200,scaling=constrained,axes=none);
with the result:

Clearly, this is not precisely the original curve, but it is close enough to be easily recognisable. One needs to rotate this curve about 27 degrees counterclockwise; this can easily be done after the curve has been plotted. Another aspect of the original logo that has not been reproduced well is the complicated intertwined nature of the curve. This structure was lost when we projected the curve onto the plane. One can now plot this curve using the command “tubeplot” in Maple, which will replace the original curve by a shiny metallic tube in three-dimensional space. At this stage, one can experiment with the functional dependence in the third dimension to come up with precisely the same shape as in the original logo. The degree of entanglement within the original logo did not come across well when I attempted generating plots in three dimensions. Hence, I took the liberty of slightly simplifying the curve topologically, and used the following Maple commands:
> tmp1:=plots[tubeplot]([cos(7*t)-3*sin(3*t),sin(7*t)-3*cos(3*t),cos(5*t)],t=0..4*Pi,orientation=[27,0],radius=0.7,numpoints=1500,tubepoints=100,style=patchnogrid,shading=zgrayscale,light=[60,0,1,1,1],ambientlight=[0.2,0.2,0.2]):tmp2:=plots[tubeplot]([cos(7*t)-3*sin(3*t),sin(7*t)-3*cos(3*t),cos(5*t)],t=0..2*Pi,orientation=[27,0],radius=0.75,numpoints=300,tubepoints=20,style=wireframe,shading=zgrayscale,color=[0.992,0.992,0.992]):plots[display]([tmp1,tmp2]);
Although these statements may appear fairly complicated, in fact, they simply plot the same curve as we plotted above, with the third dimension added using the formula z=cos(5t). The curve is plotted twice: first time to generate a shiny metal tube, and the second time to generate a net outside that adds a bit of sophistication to the image. The result of all these manipulations is as follows:
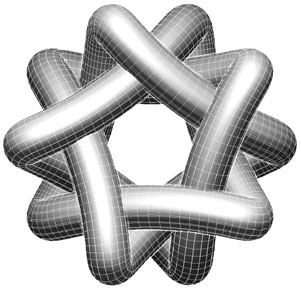
It is quite remarkable that this plot was generated by Maple in a matter of minutes, even though the degree of its shininess easily matches that of the London Olympics' mascots Wenlock and Mandeville. I sincerely hope that the LMS logo will never look even remotely like this.