MRes Bioinformatics: Systems Biology Lab 4: Biochemical Pathways
This lab is a continuation of the modelling activities that you have
performed in
lab 3,
in order to give you practical experience in the construction and simulation of models of biochemical networks.
BioNessie:
- BioNessie http://www.bionessie.com is a software tool which allows users to compose models of biochemical systems using biochemical equations, and to save these models as in SBML format (see http://www.sbml.org for model details on SBML---basically, it is a mark-up language for biochemical models).
- BioNessie enables the simulation of dynamic behaviour of biochemical models using a differential equation solver, and displays the results graphically. It also supports advanced analysis methods, including parameter scans and sensitivity analysis.
- BioNessie is available at
/Desktop/ZSBPS/bps/bin/bps.exe. For more information about using BioNessie, please see the BioNessie user manual.
Exercise 1
Preliminary:
Experiment with the implementation of Euler's method which is at
http://www.csun.edu/~hcmth018/EuM.html.
-
Give the differential equation for the biochemical reaction A →
B with rate constant k
-
Use the applet at
http://www.csun.edu/~hcmth018/EuM.html.
to solve the equation for [A]init = 5, [B]init = 0, k=0.5.
Hint:
-
set f(x,y) to be the right-hand side of your differential equation.
-
Set x_0 to be the initial time t0
-
Set y_0 to [A]init
-
Set b to t_final (whatever that is).
-
Set n to the number of intervals over which to use, for example 5.
(Then h = (b - x_0)/n is the step size.)
-
A step size of less than 10 will force the programe to step through the computation.
-
You can increase the step size to greater than 10 to obtain a continuous
computation.
(A) With the experience of modelling equation (5), can you code and simulate a Metabolic Pathway and Signalling Pathway? See slide 28 from the lecture notes for more details of pathways. Refer to following information to model and simulate the pathways.
- Rate constants are the same as that in equation (5).
- Initial concentration of all enzyme-substrate complexes is given to 0.
- Initial concentration of substrates, products and enzymes involved in these two pathways are:
- Metabolic Pathway: [E1] = [E2] = [E3] = 1; [S] = 100; [S'] = [S''] = [S'''] = 0
- Signalling Pathway: [Input Signal] = 1; [S1] = [S2] = [S3] = 100; [P1] = [P2] = [P3] = 0
(B) Create models for the following small pathways and investigate their
behaviours:
- phosphorylation-dephosphorylation stage, Mass-Action (slide 42, or 43 or
44).
- 2-stage phosphorylation cascade, Mass-Action (slide 48).
- 2-stage phosphorylation cascade, with negative feedback, Mass Action
(slide 52).
(C) Under certain conditions a negative feedback loop can cause oscillations.
I have created one such system, based on slide 54 in the notes.
You can obtain the SBML model for this oscillator
here,
BY USING 'RIGHT CLICK' AND THEN 'SAVE LINK AS'. Then import it into
BioNessie, and explore its behaviour.
Exercise 2 -- preparation for the Coursework
In this exercise, you will use BioNessie to create a computational model for the Raf-1/RKIP/ERK pathway and run simulations to produce time-series plots of the pathway. The Raf-1/RKIP/ERK pathway is an ubiquitous pathway interesting to many researchers. An understanding of the functioning of this pathway is helpful for the study of signal transduction, cell differentiation and division, and other pathways in general. The structure of this pathway is shown below. In this graph, circle represents species of the pathway and box represents rate constants of the reactions involved in the pathway. In each reaction, species at which an arrow originates are called reactants, and species to which an arrow points are products.
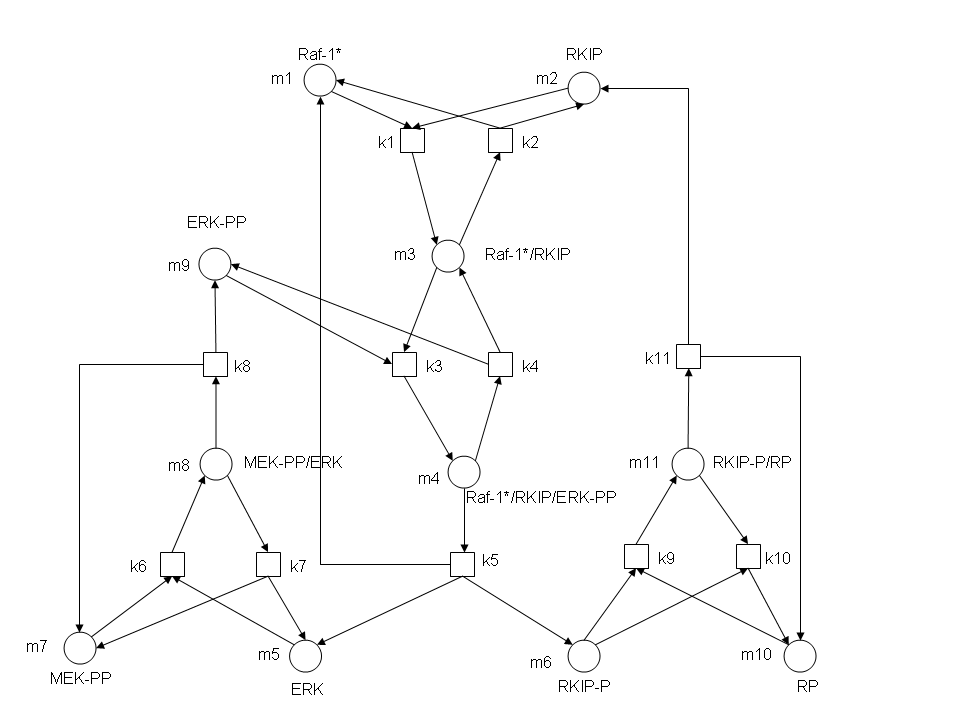
Rate constants and initial concentrations required for the modelling and simulation of the pathway are:
- k1 = 0.53; k2 = 0.0072; k3 = 0.625; k4 = 0.00245; k5 = 0.0315; k6 = 0.8; k7 = 0.0075; k8 = 0.071; k9 = 0.92; k10 = 0.00122; k11 = 0.87
- [m1] = 2.5; [m2] = 2.5; [m3] = 0; [m4] = 0; [m5] = 0; [m6] = 0; [m7] = 2.5; [m8] = 0; [m9] = 2.5; [m10] = 3; [m11] = 0